07COT by Market — The Single-Market Deep Dive
VaultSingle-market view
Nav → COT Intelligence → COT by Market (or click any market on the Intelligence board)
№ MAP PINS — the gold markers on this screenshot point at locations on the panel; each is explained in the legend beside it. (They are separate from the teal STEP numbers in Part 1.)
1
2
3
4
5
6
7
8
9
10
11
What it is
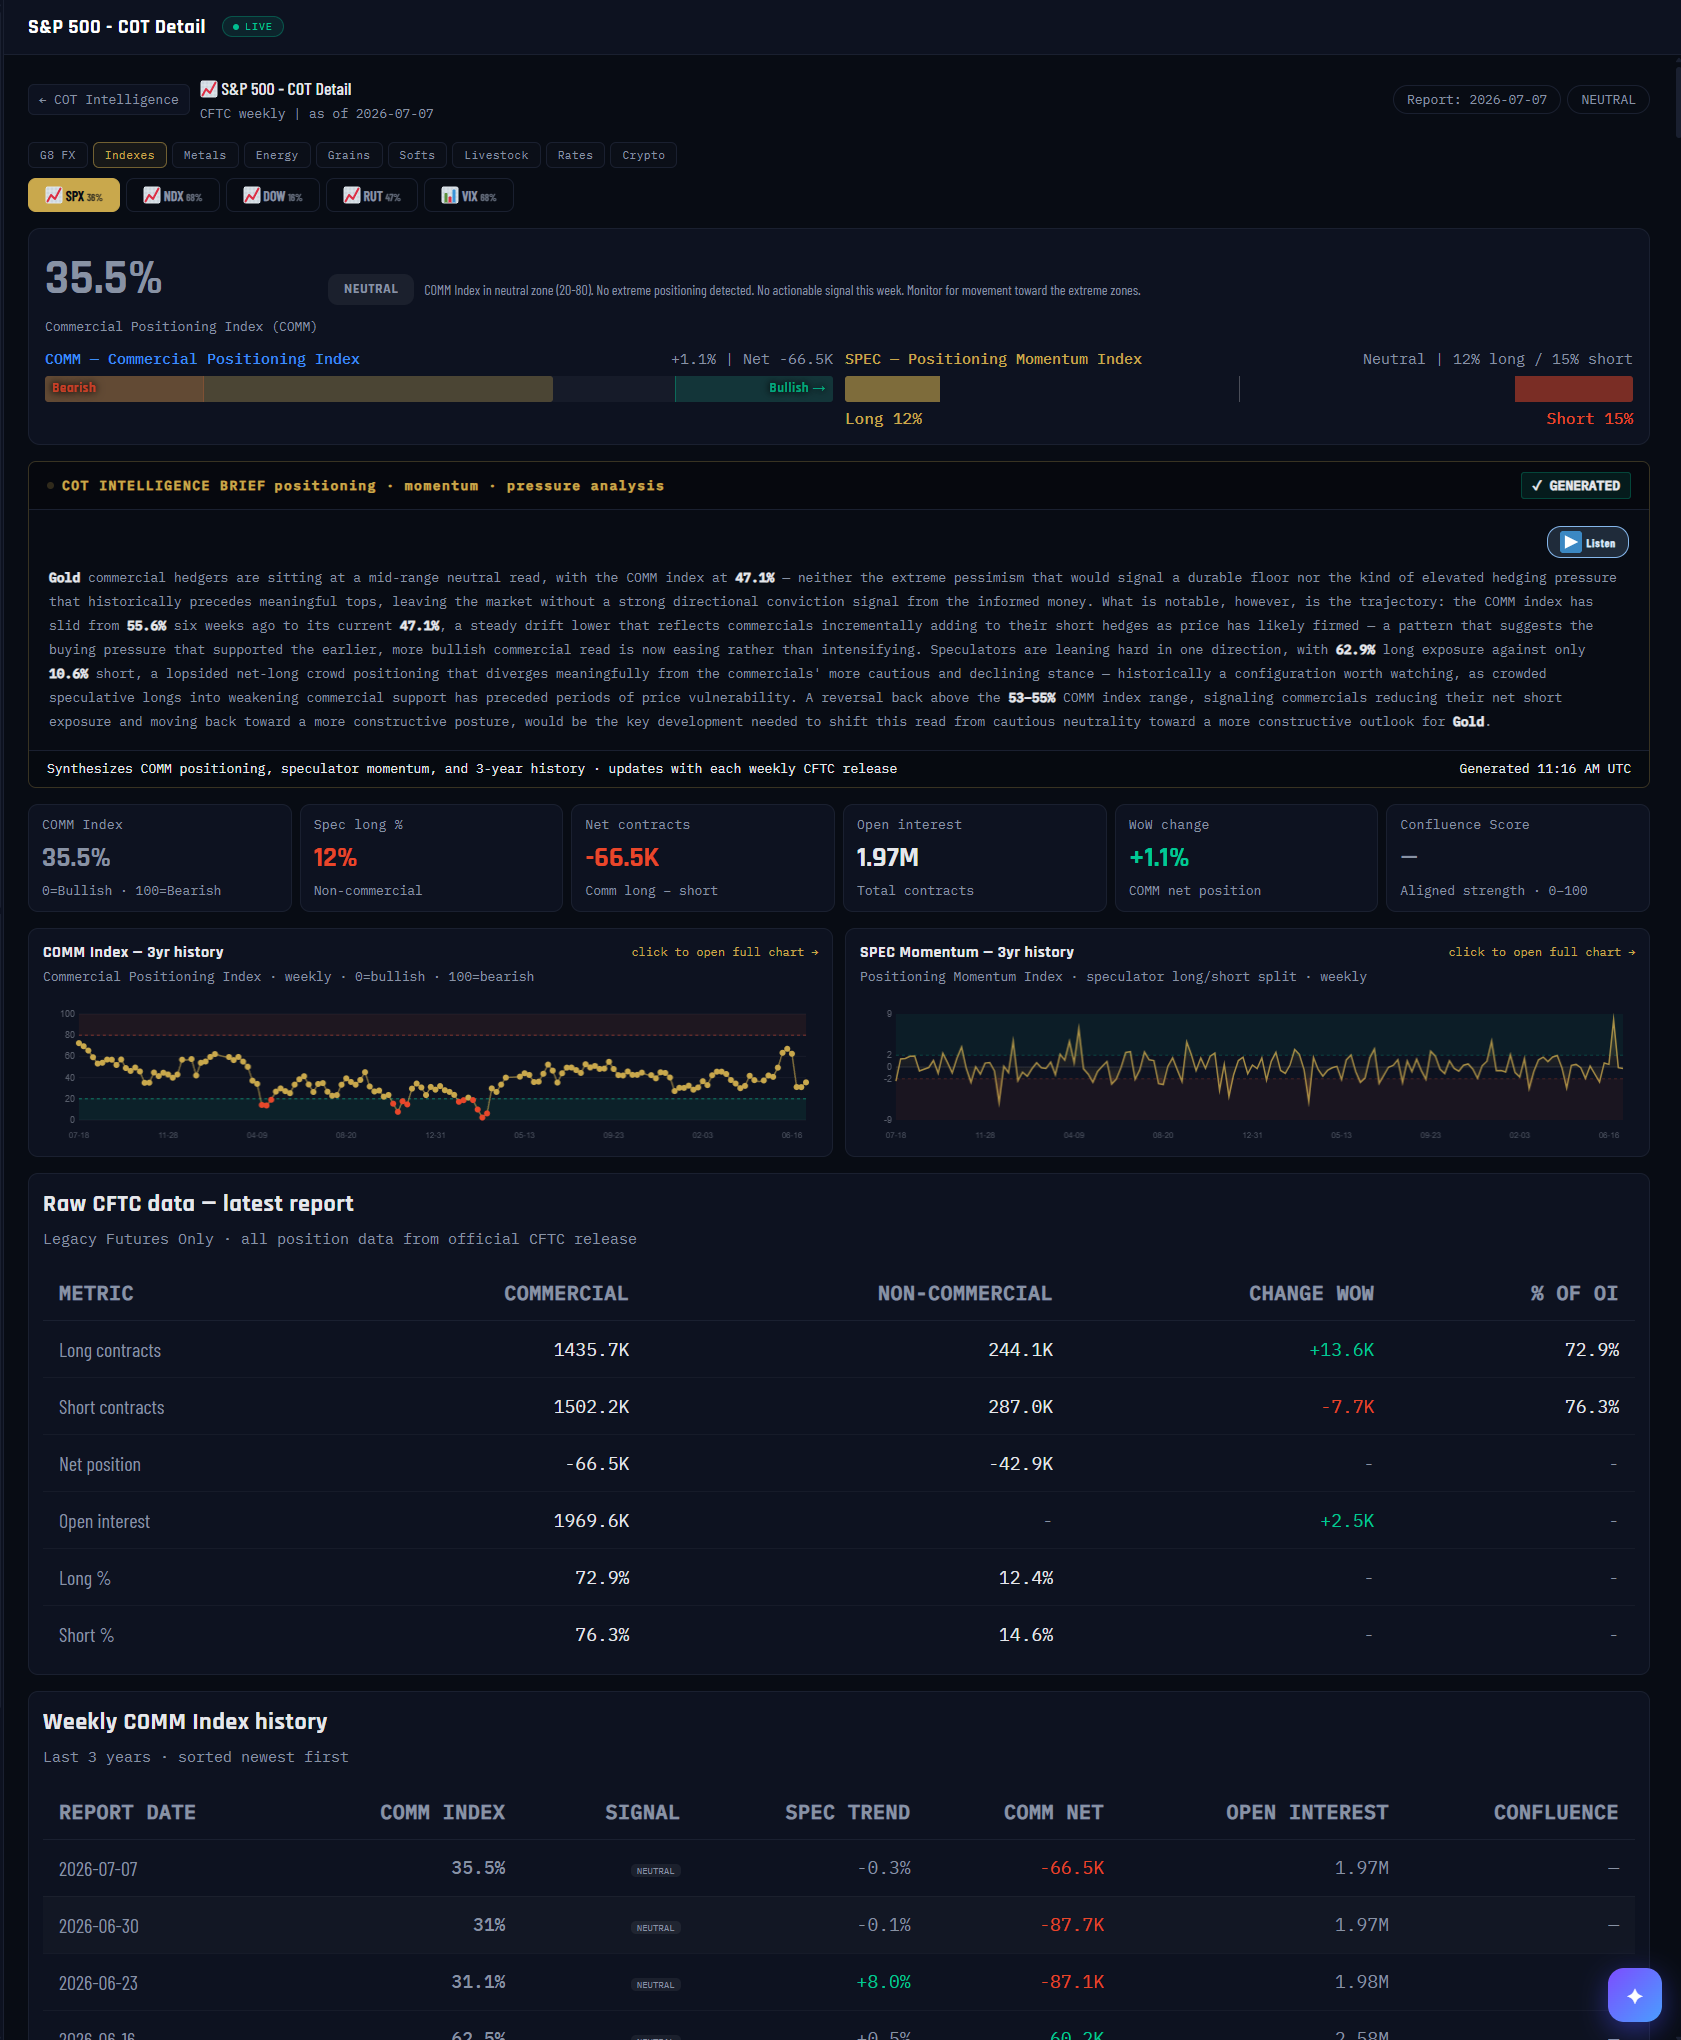
The full dossier on one market — every COT number the CFTC publishes for it, this week and three years back, on a single page. You usually arrive here by clicking a market on the COT Intelligence board; the class tabs and market chips at the top let you jump anywhere without leaving.
What it measures
Everything, for one market: the COMM Index headline (commercial positioning inside its 3-year range — the screenshot shows the S&P 500 at 35.5%, NEUTRAL), the SPEC momentum read with the crowd’s long/short split, the exact raw CFTC table (long, short, net, open interest and week-over-week change for Commercials and Non-Commercials), and the full weekly history so you can see how every reading evolved.
Why it's useful to you
Boards compress; this page shows the receipts. When a scanner reading surprises you, come here to see the actual contracts behind it before you trust it. It’s also the bridge to the price chart — the two history minicharts click through to the full COMM Index Chart with candles (next entry).
The 10-second read
Headline % and its badge → the two gauge bars (commercials vs the crowd) → any surprise, scroll to the raw table and confirm the contracts.
Use it with: COT Intelligence ·
Market HQ · the COMM Index Chart (below)
1
Market title + back link. Which market you’re dissecting, with one-click return to the Intelligence board. The report-week chip sits top-right.
2
Class tabs + market chips. Jump between asset classes and markets without leaving the deep dive. Each chip shows the market’s current spec-long share.
3
COMM Index headline. Commercial positioning inside its 3-year range with its signal badge. Note this page’s scale note: on this board the index is displayed with 0 = bullish, 100 = bearish — read the badge, not just the number.
4
The two gauge bars. COMM (commercial positioning with net contracts and weekly change) and SPEC (the crowd’s momentum with its long/short split — here 12% long vs 15% short).
5
COT Intelligence Brief. The AI analyst’s written read of positioning, momentum and pressure — regenerated with each weekly CFTC release.
6
Listen. Every brief can be read aloud — same voice system as the rest of the platform.
7
Stat cards. The week at a glance: COMM Index, spec long %, net contracts, total open interest, week-over-week change, and the confluence score when signals align.
8
COMM Index — 3-year history. Every weekly reading; red dots mark extreme-zone visits. Click to open the full chart with price candles.
9
SPEC momentum — 3-year history. The crowd’s weekly positioning swings over the same window. Also clicks through to the full chart.
10
Raw CFTC table. The unprocessed numbers from the official release — longs, shorts, net, open interest, weekly change, share of OI, for both cohorts. When in doubt, this table is the ground truth.
11
Weekly history table. Three years of report-by-report readings, newest first — index, signal, spec trend, commercial net, open interest.