What it is
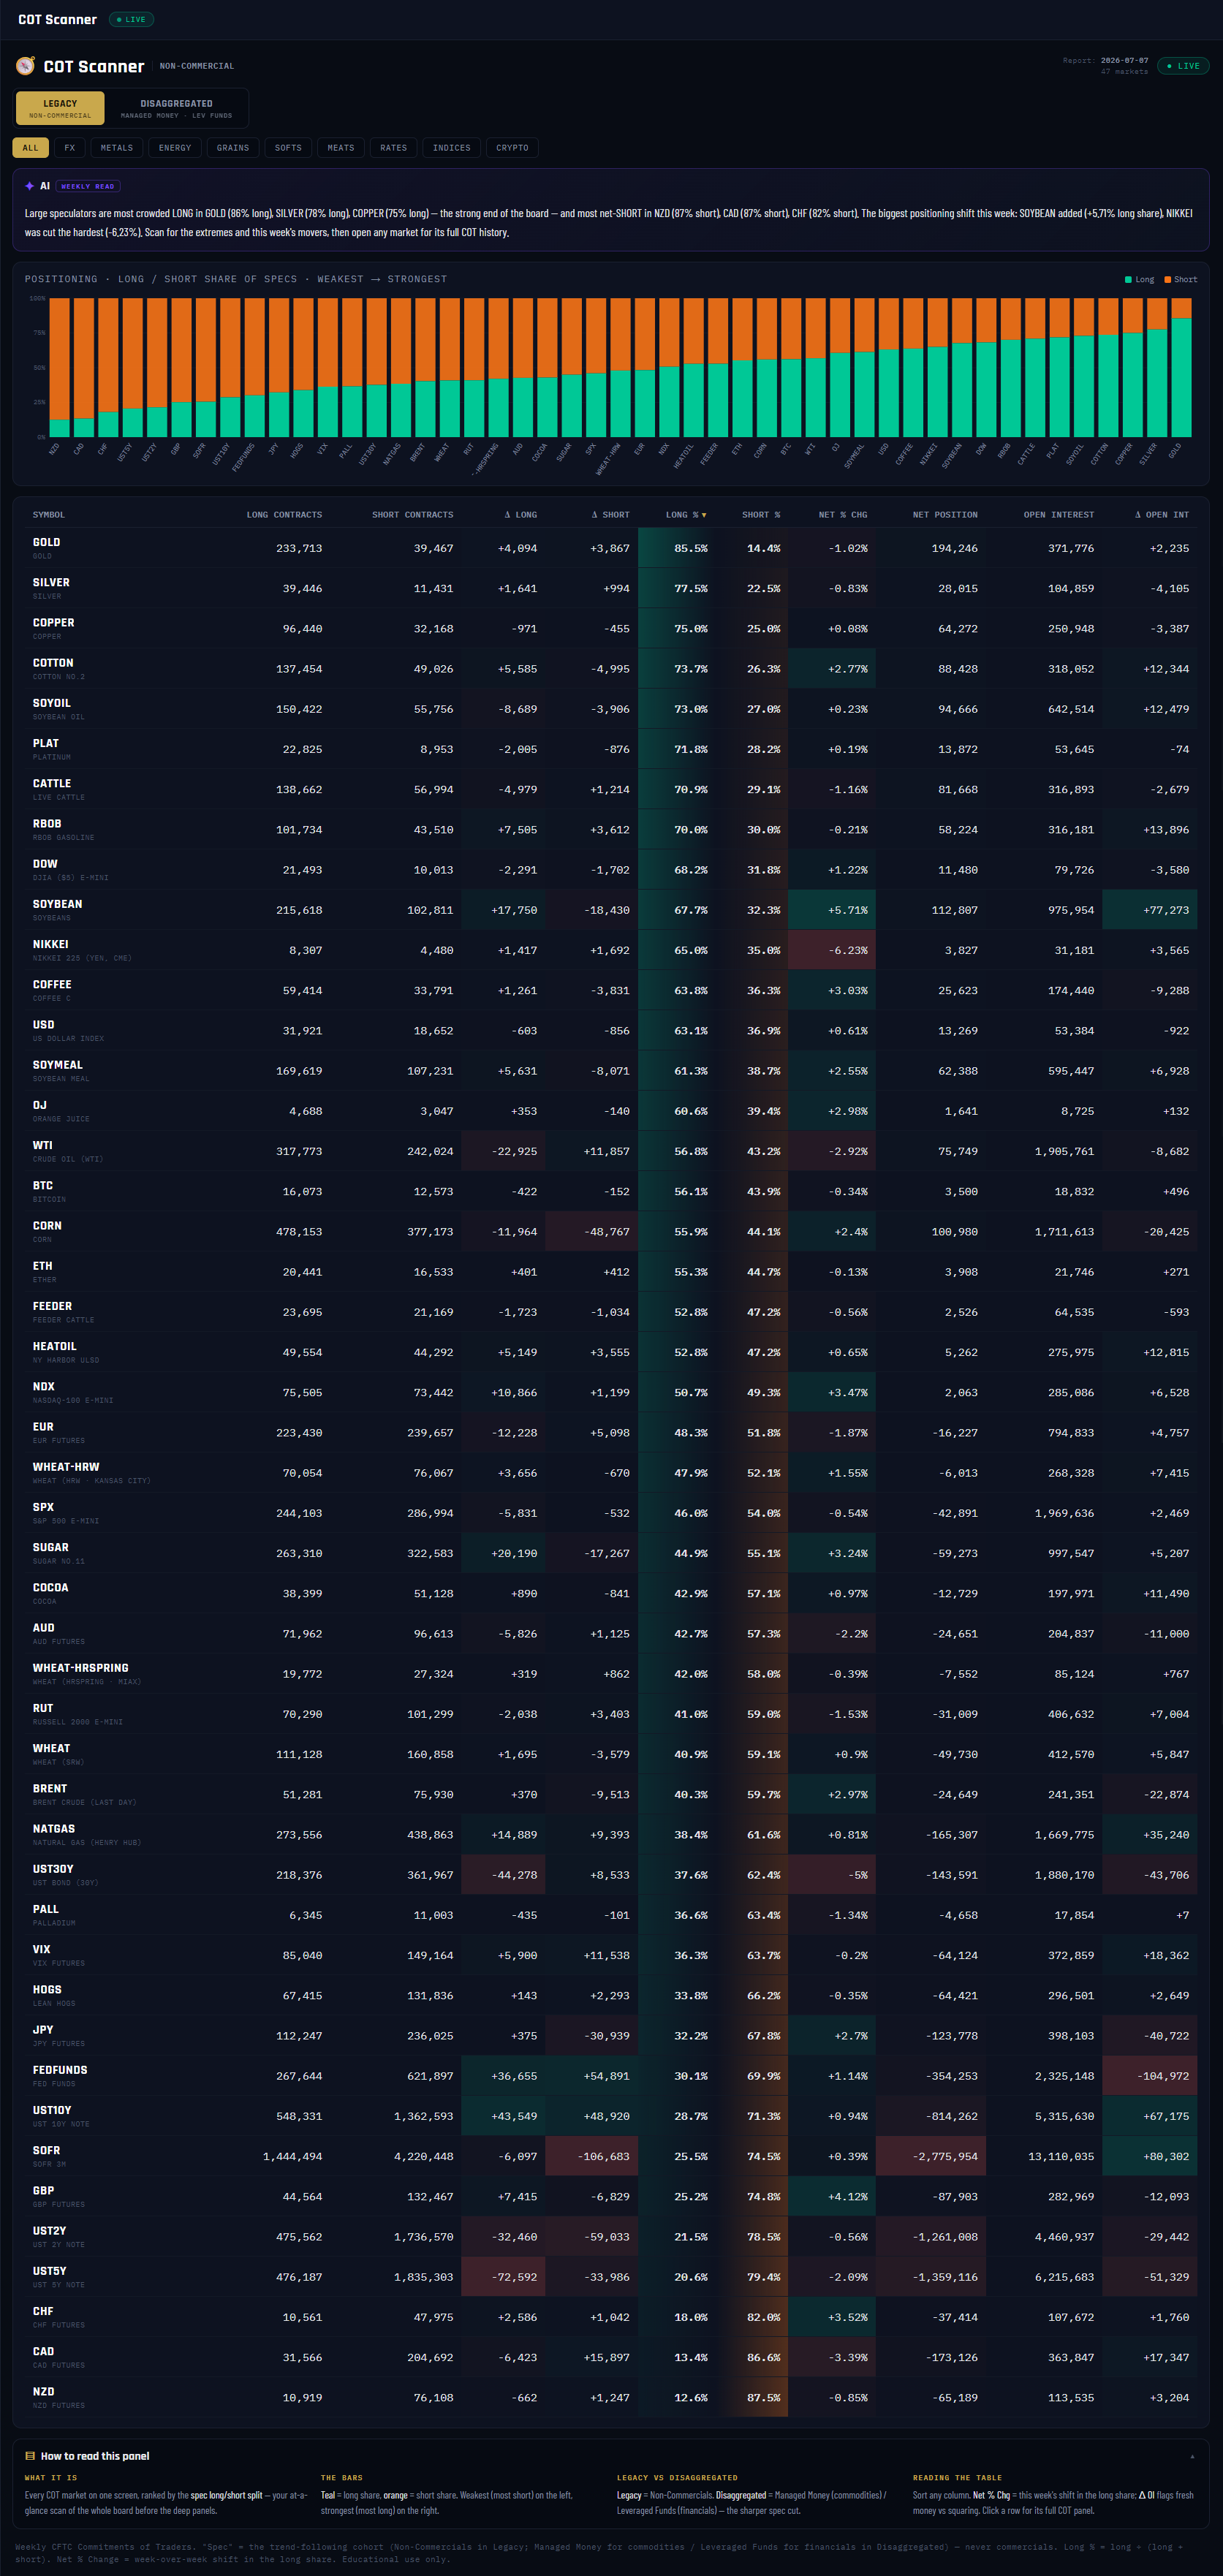
The Scanner is the master board: all 47 COT markets on one screen, ranked strongest to weakest by how one-sided speculator positioning is. Currencies, metals, energy, grains, softs, meats, rates, stock indexes and crypto — every market the deep panels cover, side by side, sortable by any column. It's the panel you open when you don't yet know which market deserves your attention this week.
What it measures
Every row is one market's speculator long/short split: Long % = long contracts ÷ (long + short), so 50% is balanced and anything near the edges is a crowd leaning hard one way. Alongside it: the raw long and short contract counts, the net position (longs minus shorts), open interest, and this week's deltas — Net % Chg is the week-over-week shift in the long share, and Δ Open Int tells you whether that shift came from new money or from positions closing. The LEGACY toggle reads Non-Commercials; DISAGGREGATED swaps in the sharper cut — Managed Money for commodities, Leveraged Funds for financial futures.
Why it's useful to you
A number in isolation lies. "60% long" sounds bullish until you see 46 other markets around it and realize it's mid-pack. The Scanner gives every reading its context in one glance — the crowded extremes at both ends of the board (in the screenshot, Gold at 85.5% long on top, NZD at 87.5% short on the bottom) and the week's biggest shifts in between. It stops the most common retail mistake: deep-diving a market before checking whether anything is even happening there.
The 10-second read
Read the two ends of the bar chart — most-short on the left, most-long on the right — then sort by Net % Chg to see who moved this week. Ends = crowding; movers = flow.
Use it with: COT Flow · Movers (the movers, ranked and charted) ·
Market HQ (drill into any row) ·
Extremes & Percentile (is that crowding historic, or normal?)
1
Panel title + cohort. "NON-COMMERCIAL" names the group you're currently reading — the large speculator crowd. It updates when you flip the report toggle (pin 2), so you always know whose positions the whole board reflects.
2
LEGACY / DISAGGREGATED toggle. Legacy = the classic Non-Commercial read, available for every market. Disaggregated = the professional cut: Managed Money for commodities, Leveraged Funds for financials — the purest speculator cohort the CFTC publishes. Same board, sharper lens.
3
Class tabs. Filter the board to one asset class — FX, METALS, ENERGY, GRAINS, SOFTS, MEATS, RATES, INDICES, CRYPTO — or ALL for the full 47. Rankings recompute within whatever you select.
4
Report date + LIVE chip. The CFTC report week every number on this board comes from (2026-07-07 in the screenshot), plus the market count. Almost every week that is one date for the whole board; if a market's CFTC ingest is behind, its row carries its own older date and the header says how many are behind, so you always know what you are comparing.
5
AI WEEKLY READ. A plain-English summary generated from the board itself: which markets are most crowded long, most net-short, and the week's biggest add and cut (in the screenshot, Soybean +5.71% added, Nikkei −6.23% cut). It always matches the table below it — it's a narration of this data, not an opinion.
6
Positioning bar chart. Every market as a stacked bar — teal = long share, orange = short share — arranged weakest (most short) on the left to strongest (most long) on the right. The shape of the whole board in one glance: a lot of tall teal on the right means the spec crowd is broadly risk-on.
7
Table header — every column sorts. Symbol, Long/Short Contracts, Δ Long, Δ Short, Long %, Short %, Net % Chg, Net Position, Open Interest, Δ Open Int. Click any header to re-rank the board by that question. The ▼ marks the current sort.
8
LONG % column (default sort). The share of speculator contracts that are long, heat-shaded so extremes glow. This is the ranking number: comparable across every market regardless of size, which is exactly why the board leads with it instead of raw contracts.
9
NET % CHG + Δ OI. Net % Chg = how many percentage points the long share moved since last week — the "what just happened" column. Read it with Δ Open Int: a shift on rising OI = fresh money entering with conviction; a shift on falling OI = old positions closing out. Same shift, very different meaning.
10
Top row — the most crowded long. In the screenshot Gold leads the board at 85.5% long. Top and bottom rows are the crowding extremes — the markets where the speculator crowd is closest to all-in, and where the reversal-watch panels earn their keep. Click any row to open that market's full COT panel.
11
HOW TO READ THIS PANEL. The built-in explainer — collapsed by default, one click open. Covers the bars, the two report lenses, and the table columns.