What it is
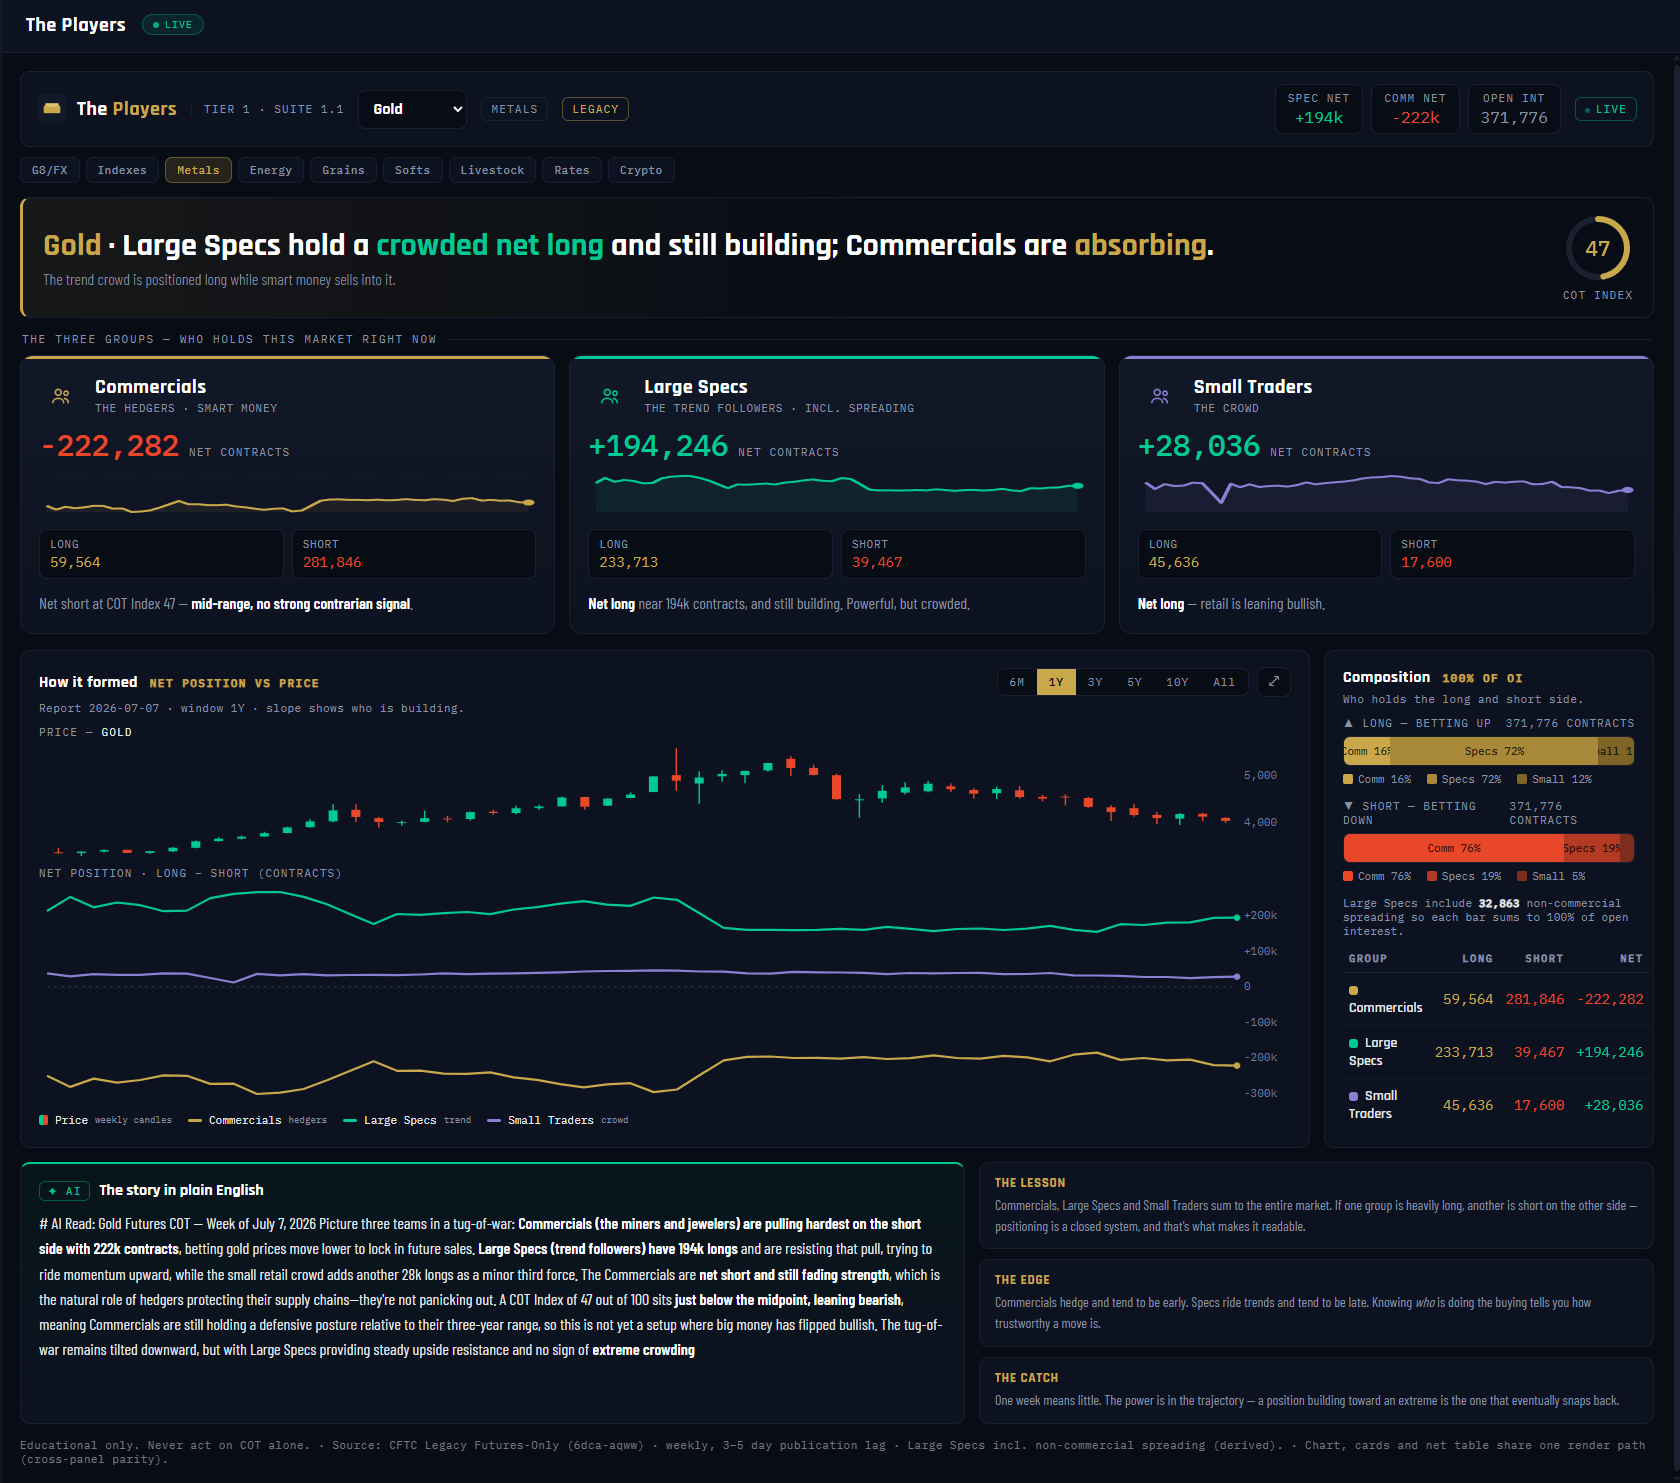
The Players is where every deep read begins: it splits one market into the three groups the CFTC's Legacy report tracks — Commercials, Large Speculators and Small Traders — and shows exactly whose money sits where. In the Gold example, Large Specs hold a crowded +194,246 net long while Commercials sit -222,282 net short on the other side. Every other panel assumes you know this picture; this one draws it.
What it measures
For each group the panel takes long contracts minus short contracts = net position, straight from the week's Legacy Futures-Only report (2026-07-07 here). The Composition bars restate the same data as shares of total open interest — 371,776 contracts in Gold — with non-commercial spreading folded into Large Specs so each bar sums to exactly 100% of OI. The COT Index dial places the Commercials' net inside its 3-year range on a 0–100 scale: high = Commercials heavily net long = bullish backdrop. Gold reads 47 — mid-range.
Why it's useful to you
A move means different things depending on who is doing the buying. Commercials are hedgers — historically early, buying weakness and selling strength. Large Specs are the trend crowd — right mid-trend, wrong at the turns. When you see Specs maxed long and Commercials absorbing the other side (exactly Gold's picture here), you know the trend is mature and running on the crowd's money. Skipping this panel is how retail traders end up buying a market whose informed side is quietly selling to them.
The 10-second read
Verdict banner first, then the three net cards: who's long, who's short, how big. Glance at the dial — near 80 or 20 means the backdrop itself is stretched. Done.
Use it with: The COT Index (how stretched is this net, historically) ·
Net Change & Flow (what these groups did this week) ·
The Specialists (the sub-groups hiding inside "Large Specs")
1
Market picker. The dropdown drives the whole panel — Gold here, tagged METALS and LEGACY (the report family this Tier 1 panel reads). Switch markets and every card, chart and narrative recomputes.
2
Stat chips. The headline in three numbers: SPEC NET +194k, COMM NET -222k, OPEN INT 371,776. If you read nothing else, read these.
3
Verdict banner. The panel's one-line conclusion: "Large Specs hold a crowded net long; Commercials are absorbing." Plain English before any chart.
4
COT Index mini-dial. The Commercials' net placed in its 3-year range, 0–100. High = Commercials heavily net long = bullish backdrop; low = bearish. Gold's 47 says the backdrop itself is neutral even though the Specs are crowded.
5
Commercials card. The hedgers — producers, processors, banks hedging real exposure. Net -222,282 with the full long/short split below. They are short because someone must be — they sell strength to the crowd.
6
Large Specs card. Funds and CTAs — the trend crowd. Net +194,246. This is the position that measures how crowded the Gold trend is.
7
Small Traders card. Positions too small to require reporting — mostly retail. Net +28,036, riding along with the Specs.
8
"How it formed" chart. Each group's net position drawn against price over the selected window. The trajectory matters more than the level — a net building toward an extreme is the one that eventually snaps back.
9
Window tabs. 6M / 1Y / 3Y / 5Y / 10Y / All — how much history the chart shows. Lookback only; it changes no calculation.
10
Composition — 100% of OI. Who holds the long side and who holds the short side, as shares of open interest. Positioning is a closed system: every long has a short on the other side, and these bars prove it sums.
11
✦ AI — "The story in plain English." A cached note regenerated once per CFTC release: the three-group tug-of-war, who's building, who's fading. Educational context, never a trade call.
12
The Lesson / The Edge / The Catch. The built-in teaching cards: the groups sum to the whole market, knowing who is buying tells you how trustworthy a move is, and one week means little — trajectory is the tell.