10The COT Index — Positioning on a 0–100 Dial
VaultSingle-market view
Nav → Beginner → The COT Index
№ MAP PINS — the gold markers on this screenshot point at locations on the panel; each is explained in the legend beside it. (They are separate from the teal STEP numbers in Part 1.)
1
2
3
4
5
6
7
8
9
10
11
12
What it is
Raw net positions don't travel: is Commercials -222k in Gold a lot, or nothing? The COT Index answers that by rescaling a group's net position into 0–100 against its own history — 100 = the most net long that group has been in the window, 0 = the most net short. It's the platform's single most reused number, and this panel is where you learn to read it properly.
What it measures
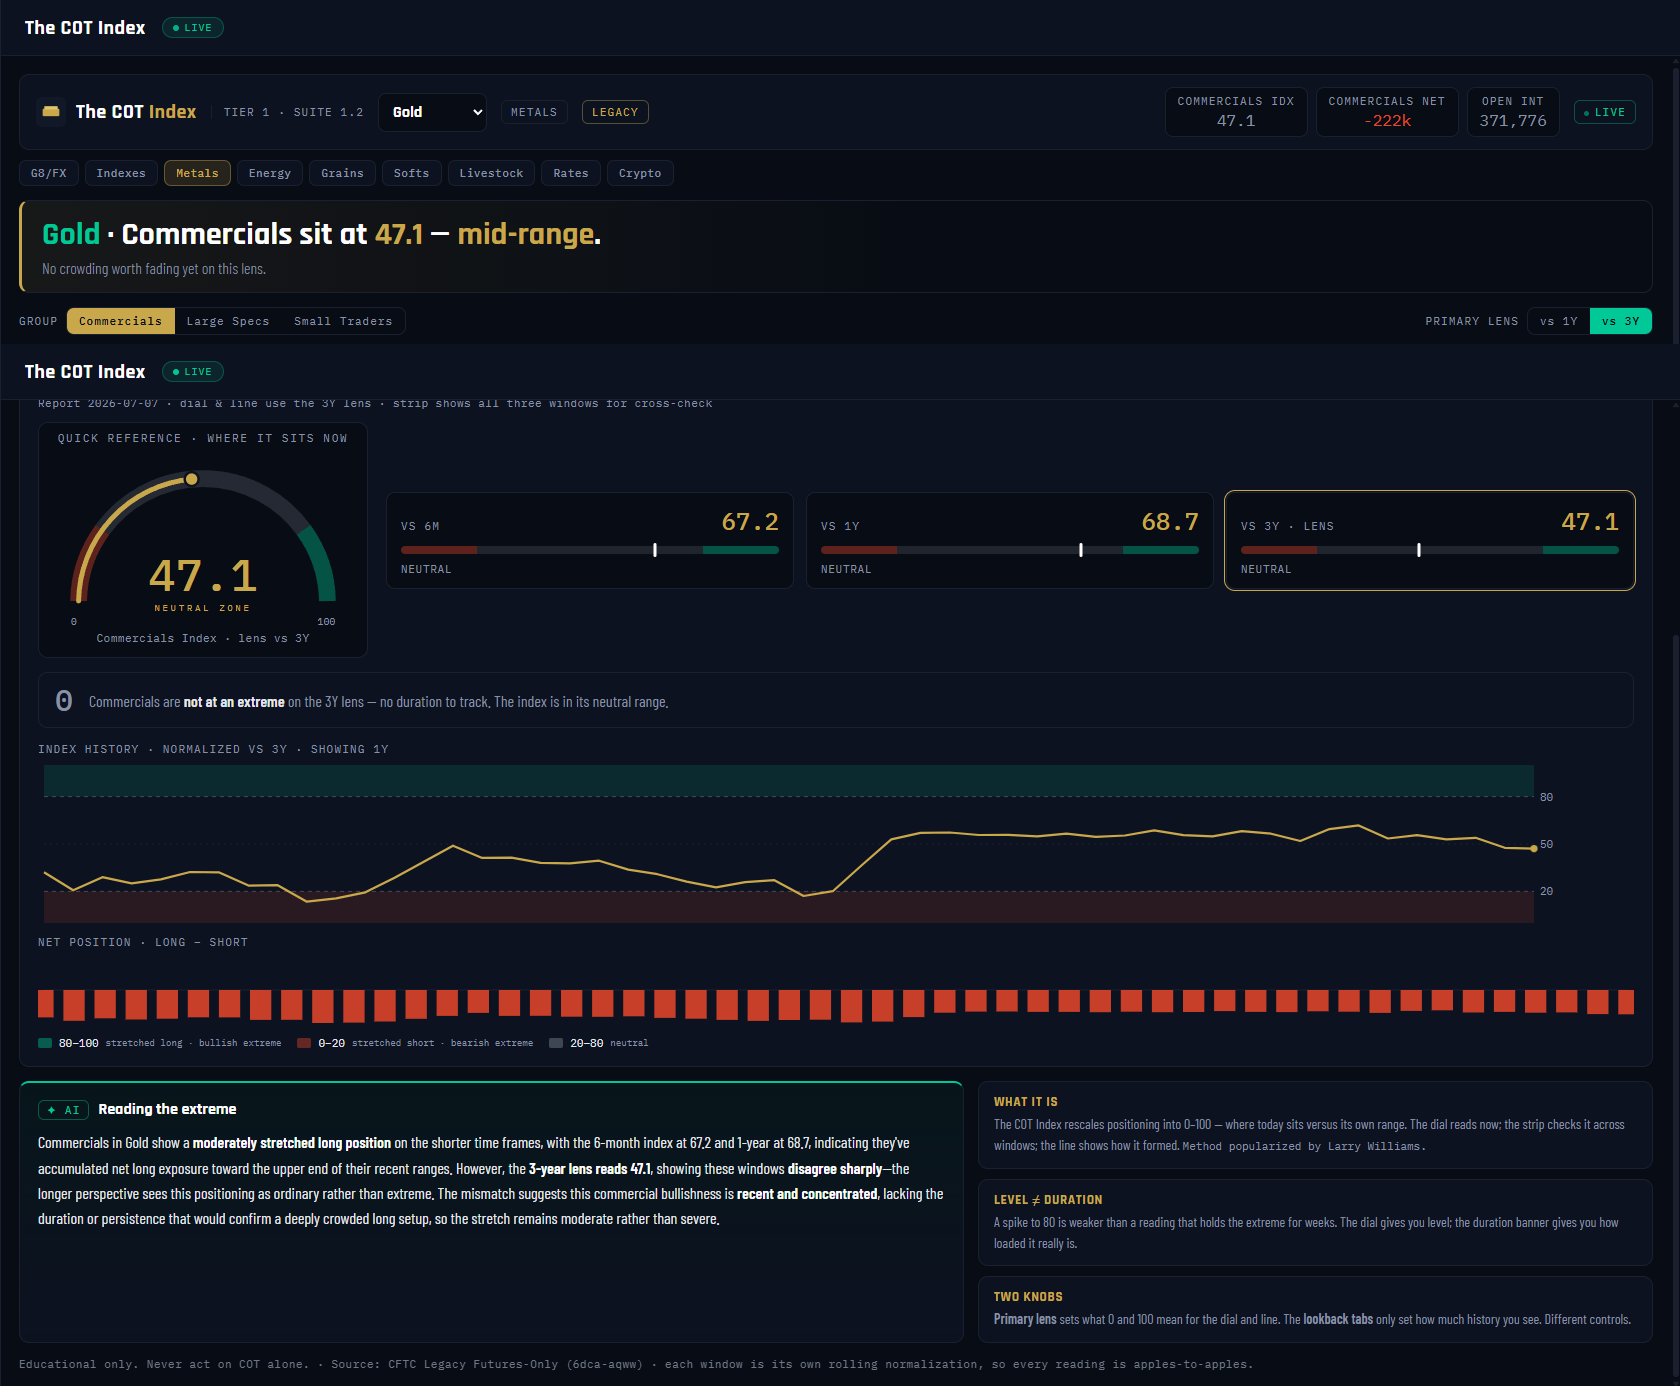
A rolling percentile: today's net position placed inside its trailing min–max range. The default window is 3 years (156 weekly reports); the strip also computes 6-month and 1-year versions so you can see whether the windows agree. For Gold's Commercials on 2026-07-07 they don't: vs 6M = 67.2, vs 1Y = 68.7, vs 3Y = 47.1 — elevated against recent history, ordinary against the full three years. The 0–100 convention never inverts: high = that group heavily net long, and on the Commercials that means a bullish backdrop. Extremes live at roughly 80/20; the duration banner starts counting once the index holds the near-extreme band (75/25) for consecutive weeks.
Why it's useful to you
This is the number that turns "big" into "stretched." A market can carry a huge net for years — the COT Index tells you when that net is at the edge of everything it has done in three years, which is where trends get old and reversals are born. It also stops a classic beginner mistake: reacting to a 6-month spike that the 3-year lens shows is mid-range noise. Gold here is exactly that lesson — 68.7 on the 1-year lens, 47.1 on the 3-year: no extreme, no story yet.
The 10-second read
Dial first: above 80 or below 20 = stretched, anywhere else = context only. Then the duration banner — an extreme that has held for weeks outranks a fresh spike every time.
Use it with: The Players (the raw nets behind the index) ·
Extremes & Percentile (the same idea, stress-tested across 4 windows) ·
Market HQ (this dial beside every other lens)
1
Market picker. Gold selected. Everything on the panel — dial, window cards, history — recomputes per market from the Legacy Futures-Only data.
2
Stat chips. COMMERCIALS IDX 47.1 · NET -222k · OPEN INT 371,776. The index and the raw net it was computed from, side by side.
3
Verdict banner. "Commercials sit at 47.1 — mid-range." The panel's conclusion in one line, before you touch a control.
4
GROUP toggle. Commercials / Large Specs / Small Traders — the index can be computed on any group's net. Default is Commercials, the platform's lead read: high = Commercials heavily net long = bullish.
5
PRIMARY LENS toggle. vs 1Y / vs 3Y — this sets what 0 and 100 mean for the dial and the history line. It's a different knob from the lookback tabs, which only set how much history you see.
6
Quick-reference dial. Where the group sits right now on the chosen lens: 47.1, squarely in the neutral zone of the 0–100 scale.
7
VS 6M card — 67.2. Against just the last 26 weeks, Commercials lean toward the long end of their recent range.
8
VS 1Y card — 68.7. The one-year lens agrees with the six-month: elevated, approaching but not at the 80 line.
9
VS 3Y · LENS card — 47.1. The default, highlighted lens: against three full years, this positioning is mid-range. When short windows say "stretched" and the 3-year says "ordinary," trust the longer lens — or wait for them to agree.
10
Duration banner. Counts consecutive weeks the index has held beyond the near-extreme band (≥75 or ≤25). Gold: "not at an extreme — no duration to track." Level tells you where; duration tells you how loaded it really is.
11
Index history chart. The full index line on the 3-year lens with the 80/20 extreme bands shaded — see every past visit to the edges and what the index did afterwards.
12
Net position strip. The raw weekly net (long minus short bars) underneath the index — the untransformed data the 0–100 line was built from, so the rescaling never becomes a black box.