What it is
The Checklist is the guided version of a professional COT workup: seven questions, asked in the right order, each auto-graded from live data, with a composite stance at the top. Pick a market and it runs the whole routine for you — who holds it, how stretched it is, how long it's been pinned, what moved this week, whether price agrees, how concentrated the book is, and how coiled the squeeze spring is. Each row expands into the numbers and a plain-English read, with a link to the full panel behind it.
What it measures
Each step reads the same canonical data as its parent panel. Step 1 grades the Large Specs' net position (long or short). Step 2 grades the Commercial COT Index on the 3-year window — 60+ leans bullish, 40− bearish, 80/20 mark extremes. Step 3 counts weeks pinned at an extreme. Step 4 grades this week's net contract flow and its 13-week phase. Step 5 checks price against positioning (confirming, aligned, or diverging). Step 6 scores participation quality — top-4 concentration, trader count, net as % of open interest — as a caution flag rather than a directional vote. Step 7 reads the pressure score and squeeze direction. The stance strip then counts bullish checks against bearish ones.
Why it's useful to you
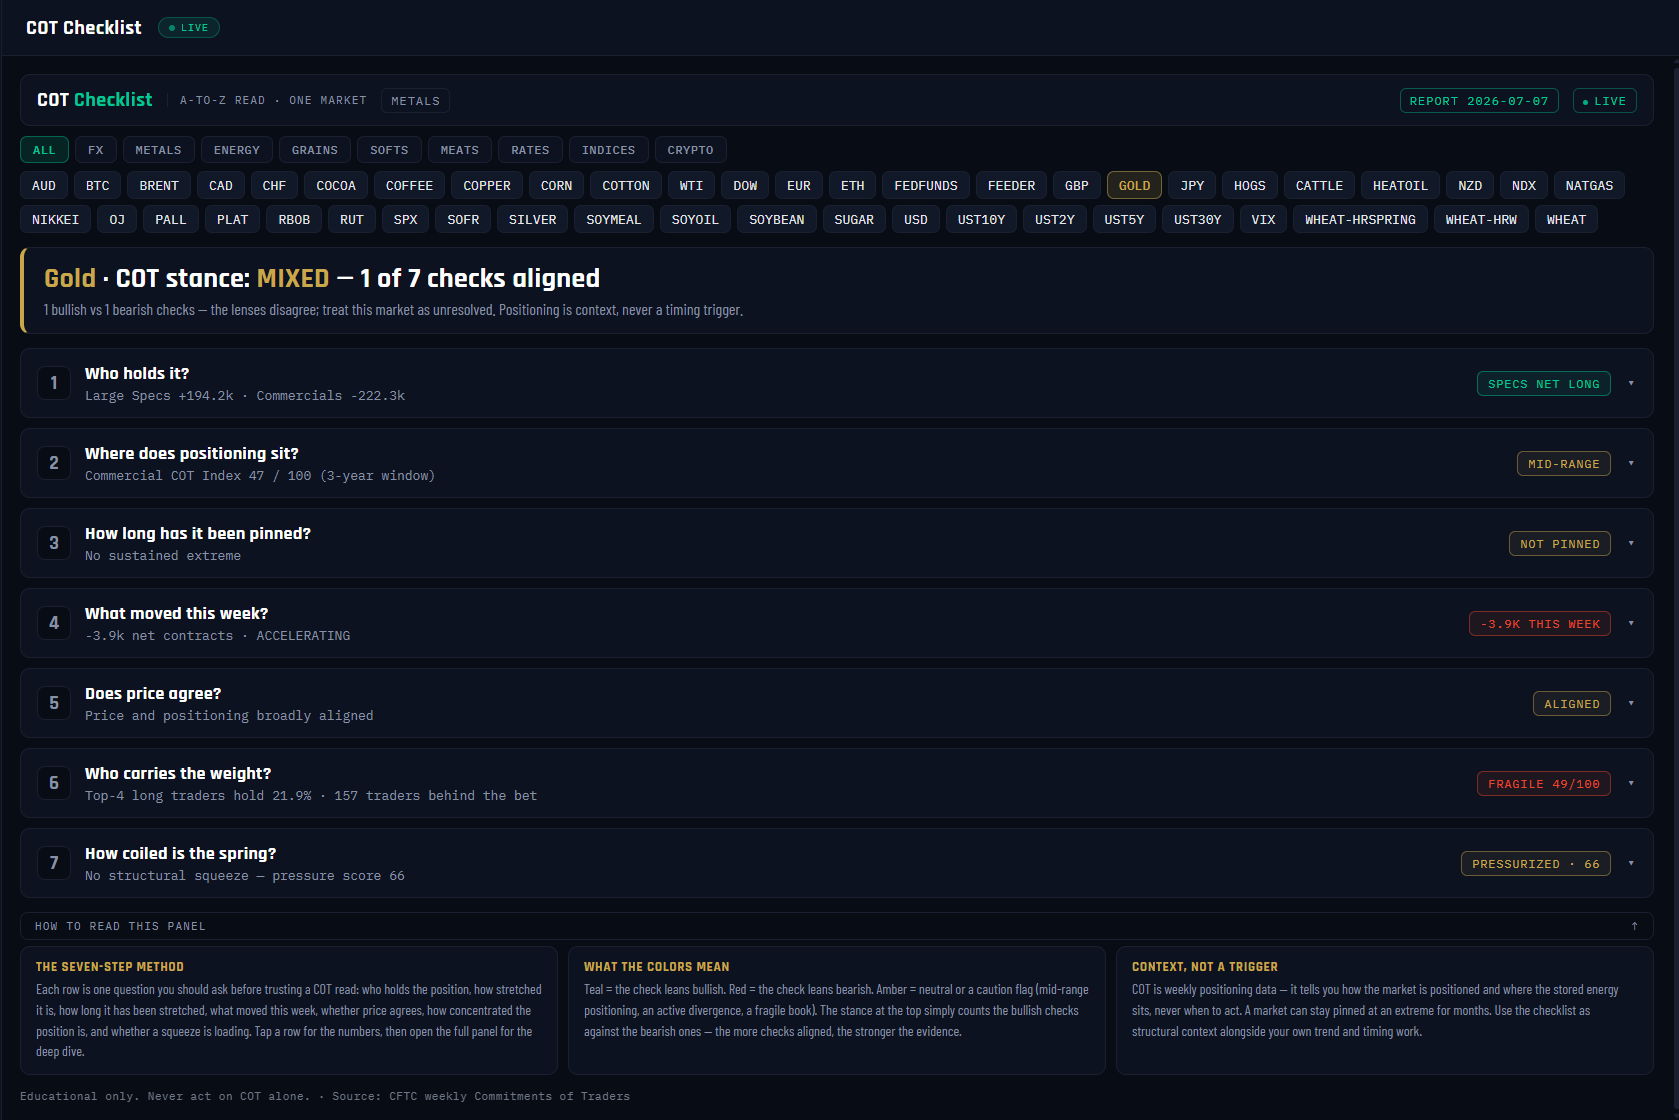
The most expensive habit in COT reading is cherry-picking: finding the one lens that agrees with the trade you already want. The Checklist makes that impossible — all seven questions get asked, every time, in the same order, and the disagreements are printed at the top. In the screenshot Gold grades MIXED — 1 of 7 checks aligned: Large Specs are +194.2k net long, but the Commercial index sits mid-range at 47, nothing is pinned, and this week's flow was −3.9k. That "unresolved" verdict is itself the finding — it tells you to wait, or to look elsewhere.
The 10-second read
Read the stance strip, then scan the seven verdict chips down the right edge. Several chips one color = evidence stacking; a rainbow = an unresolved market. Expand only the rows that surprise you.
Use it with: Market HQ (the free-scan version of the same lenses) ·
The Players (the full story behind Step 1) ·
Pressure & Squeeze (the deep dive behind Step 7)
1
Panel title. "A-to-Z read · one market" — the Checklist is deliberately single-market. It answers "should I trust a COT read on THIS market?", not "which market should I look at?" (that's the Scanner's job).
2
Market chips. Class filters plus one chip per market — GOLD selected in the screenshot. Switching markets reruns all seven checks and rebuilds the stance.
3
Composite stance strip. The headline verdict: BULLISH LEAN, BEARISH LEAN, MIXED or NEUTRAL, with "N of 7 checks aligned" counting the checks agreeing in the winning direction. In the screenshot: "Gold · COT stance: MIXED — 1 of 7 checks aligned" — the lenses disagree, so the market is treated as unresolved. The strip's left border takes the stance color: teal, red or gold.
4
Step 1 — Who holds it? The three groups' net positions from The Players: in the screenshot, Large Specs +194.2k against Commercials −222.3k, with Small Traders and open interest inside the expanded row. The expanded read also tells you which side has been building over the last month — the accumulating side is the one with conviction.
5
Verdict chip column. One auto-graded chip per step — teal = that check leans bullish, red = bearish, amber = neutral or a caution flag. This column IS the checklist: read it top to bottom before expanding anything.
6
Step 2 — Where does positioning sit? The Commercial COT Index on the 3-year window (Gold: 47/100 — MID-RANGE), with the 6-month, 1-year and Large Specs readings inside. High = Commercials net long versus their own range — historically a bullish backdrop; 80/20 mark extremes worth respecting.
7
Step 3 — How long has it been pinned? Weeks at an extreme, plus the 3-year percentile, z-score and window agreement. A one-week spike and a twelve-week pin are different animals — the longer the pin, the more fuel stored for the eventual unwind. Gold: NOT PINNED.
8
Step 4 — What moved this week? This week's net contract change against last week's, with the 13-week phase. Gold: −3.9k this week while the longer flow reads ACCELERATING — the windows disagree, so the near-term cut may just be a correction inside the larger build.
9
Step 5 — Does price agree? The divergence check: price CONFIRMING positioning (funded move), ALIGNED (no tension), or DIVERGING with a week count (tension building). Gold reads ALIGNED — no active divergence either way.
10
Step 6 — Who carries the weight? Participation quality: the quality score, top-4 concentration, trader count and net as % of OI. Gold: FRAGILE 49/100 — top-4 hold 21.9% of the long side, 157 traders behind it. This step colors as a caution, not a direction — a fragile book has a narrow exit whichever way you lean.
11
Step 7 — How coiled is the spring? The pressure score (0–100), state and squeeze direction from the Pressure gauge. Gold: PRESSURIZED · 66 with no squeeze direction — structural tension present, release not yet loaded one way.
12
HOW TO READ THIS PANEL. The seven-step method, the color key, and the rule that outranks everything: the stance simply counts checks — a market can stay pinned for months, so positioning is context, never a timing trigger.