What it is
The Scanner ranks where positioning sits; Flow ranks what it did. This board sorts every COT market by the size of this week's positioning shift — who piled in at the top, who bailed at the bottom — with a click-through detail card showing any market's full net-position history. It's the "what changed since last Friday" front door.
What it measures
For the cohort you pick — Non-Commercial (the speculator crowd) or Commercial (the hedgers) — each market gets a net % shift: this week's long share minus last week's, in percentage points. That one number ranks the board. Around it: the raw net position and its weekly change in contracts, an open interest chip (rising OI = new money entering; falling OI = positions being squared), and a sparkline of up to two years of net-position history so you can see whether this week's move extends a build or interrupts one. A glowing conviction dot marks shifts of 1.5% or more that came with rising OI.
Why it's useful to you
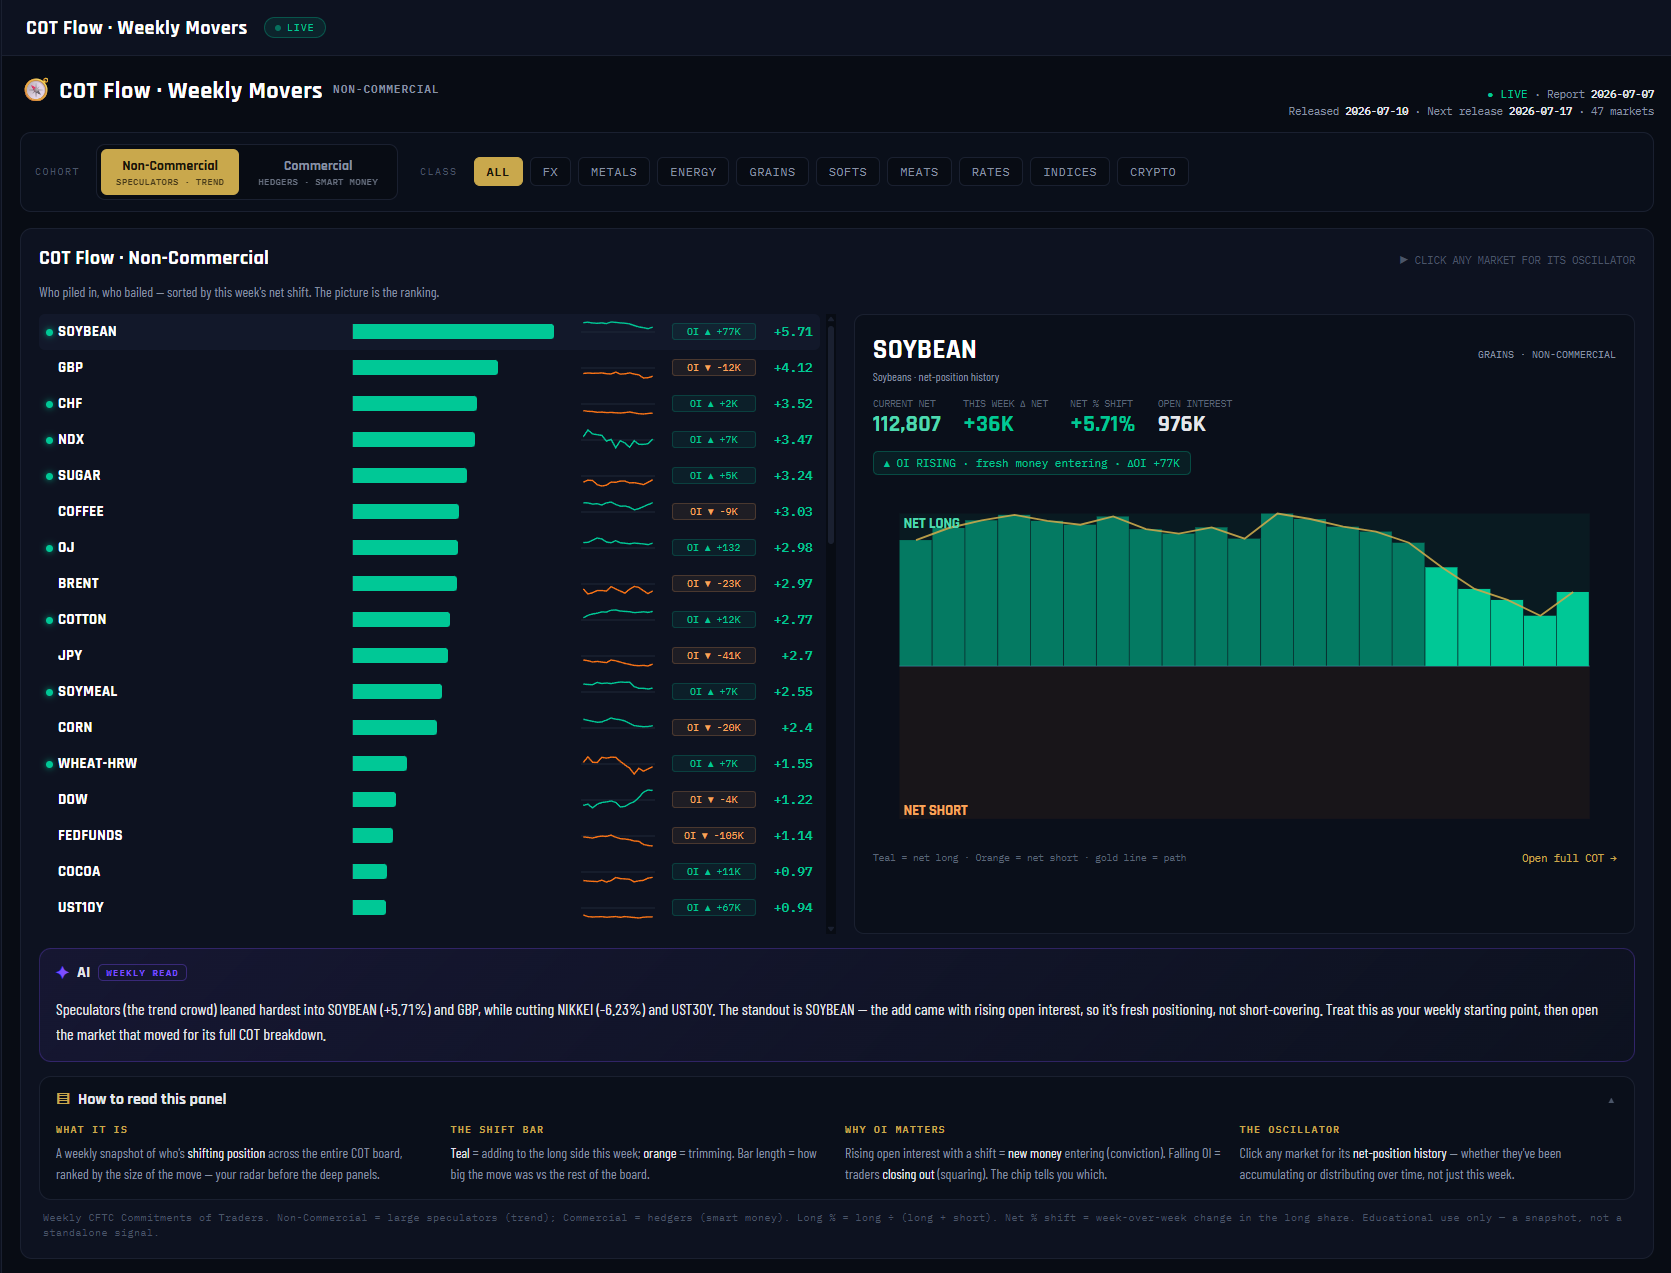
Extremes take months to form; they're born in weeks like the ones at the top of this board. Flow catches the build while it's happening — before the market shows up on any extremes list. It also protects you from the classic misread: a big shift on falling open interest is mostly old positions closing, not a new bet. In the screenshot, Soybean tops the board at +5.71% with the OI RISING verdict — that's fresh positioning, the kind worth following up.
The 10-second read
Read the top three and bottom three shift bars, then check each one's OI chip: big shift + rising OI = conviction, big shift + falling OI = housekeeping. Click anything interesting for its oscillator.
Use it with: COT Scanner (where positioning sits after the move) ·
Market HQ (every lens on the market that moved) ·
The Players (who's on the other side of the shift)
1
Panel title + cohort label. "NON-COMMERCIAL" names whose flows you're ranking. Everything on the board — bars, sparklines, the detail card — reads that one group.
2
Cohort toggle. Non-Commercial = the large speculator crowd, the trend-followers. Commercial = the hedgers, historically the informed contrarian side. Flip it to see the same week from the opposite chair — heavy commercial buying is often the mirror image of spec selling.
3
Class tabs. ALL / FX / METALS / ENERGY / GRAINS / SOFTS / MEATS / RATES / INDICES / CRYPTO — narrow the movers board to one asset class.
4
The three dates. Report 2026-07-07 (the Tuesday positions were counted), Released 2026-07-10 (the Friday the CFTC published), Next release 2026-07-17. Positioning is always a few days behind price — these chips keep the lag honest.
5
Shift bars — the ranking itself. Teal = adding to the long side this week, orange = trimming; bar length = the size of the move versus the rest of the board. In the screenshot Soybean leads at +5.71. The picture is the ranking — the biggest stories are always at the two ends.
6
Sparkline column. Each market's recent net-position path (up to two years, weekly). It answers the question the one-week number can't: is this shift the continuation of a long build, or a sudden break from one?
7
OI chips. "OI ▲ +77K" = open interest rose that many contracts this week. Rising OI with a shift = new money entering (conviction). Falling OI = traders closing out (squaring). The same +3% shift means opposite things depending on this chip.
8
Oscillator detail card. Click any market to open its deep view here — the current net position (Soybean: 112,807 net long), this week's change (+36K), and the net % shift, all in the cohort you selected.
9
The OI verdict chip. The card's one-line conclusion: ▲ OI RISING · fresh money entering or ▼ OI FALLING · positions being squared. This is the conviction filter, stated in plain words.
10
Net-position history chart. Weekly bars of the group's net position — teal above zero (net long), red below (net short) — with a gold path line tracing the journey. Accumulation and distribution campaigns that a single weekly number hides are obvious here.
11
AI WEEKLY READ. A plain-English narration of the board: who leaned hardest into what, who cut, and which add came with rising open interest (the standout). Generated from the same rows you're looking at — it always matches the bars.
12
HOW TO READ THIS PANEL. The built-in explainer — the shift bar, why OI matters, and what the oscillator shows. One click open whenever you need a refresher.