What it is
COT Intelligence is the signal board: the currency panel that turns raw weekly positioning into a short list of active bullish and bearish signals, a spectrum showing where every currency sits between the two extremes, and auto-surfaced pair matchups. Where the Scanner ranks and the deep panels explain, Intelligence decides what counts as a signal — and shows you only what cleared the bar this week.
What it measures
The engine is the Commercial positioning index (COMM): each currency's Commercial net position placed inside its 3-year range on a 0–100 scale. Platform convention: high COMM = Commercials heavily net long = bullish backdrop. A signal fires only at the edges — COMM ≥ 80 is bullish, ≤ 20 is bearish; everything between is neutral and merely monitored. Each active row also shows the week-over-week change, the net contract position, and the SPEC Positioning Momentum bars (the speculator long/short split). When the COMM signal and the SPEC momentum agree on the same currency, it earns the ⚡ Confluence Score — the strongest read this board produces. The DISAGGREGATED toggle swaps in specialist positioning (Managed Money / Leveraged Funds), read as positioning states rather than buy/sell signals.
Why it's useful to you
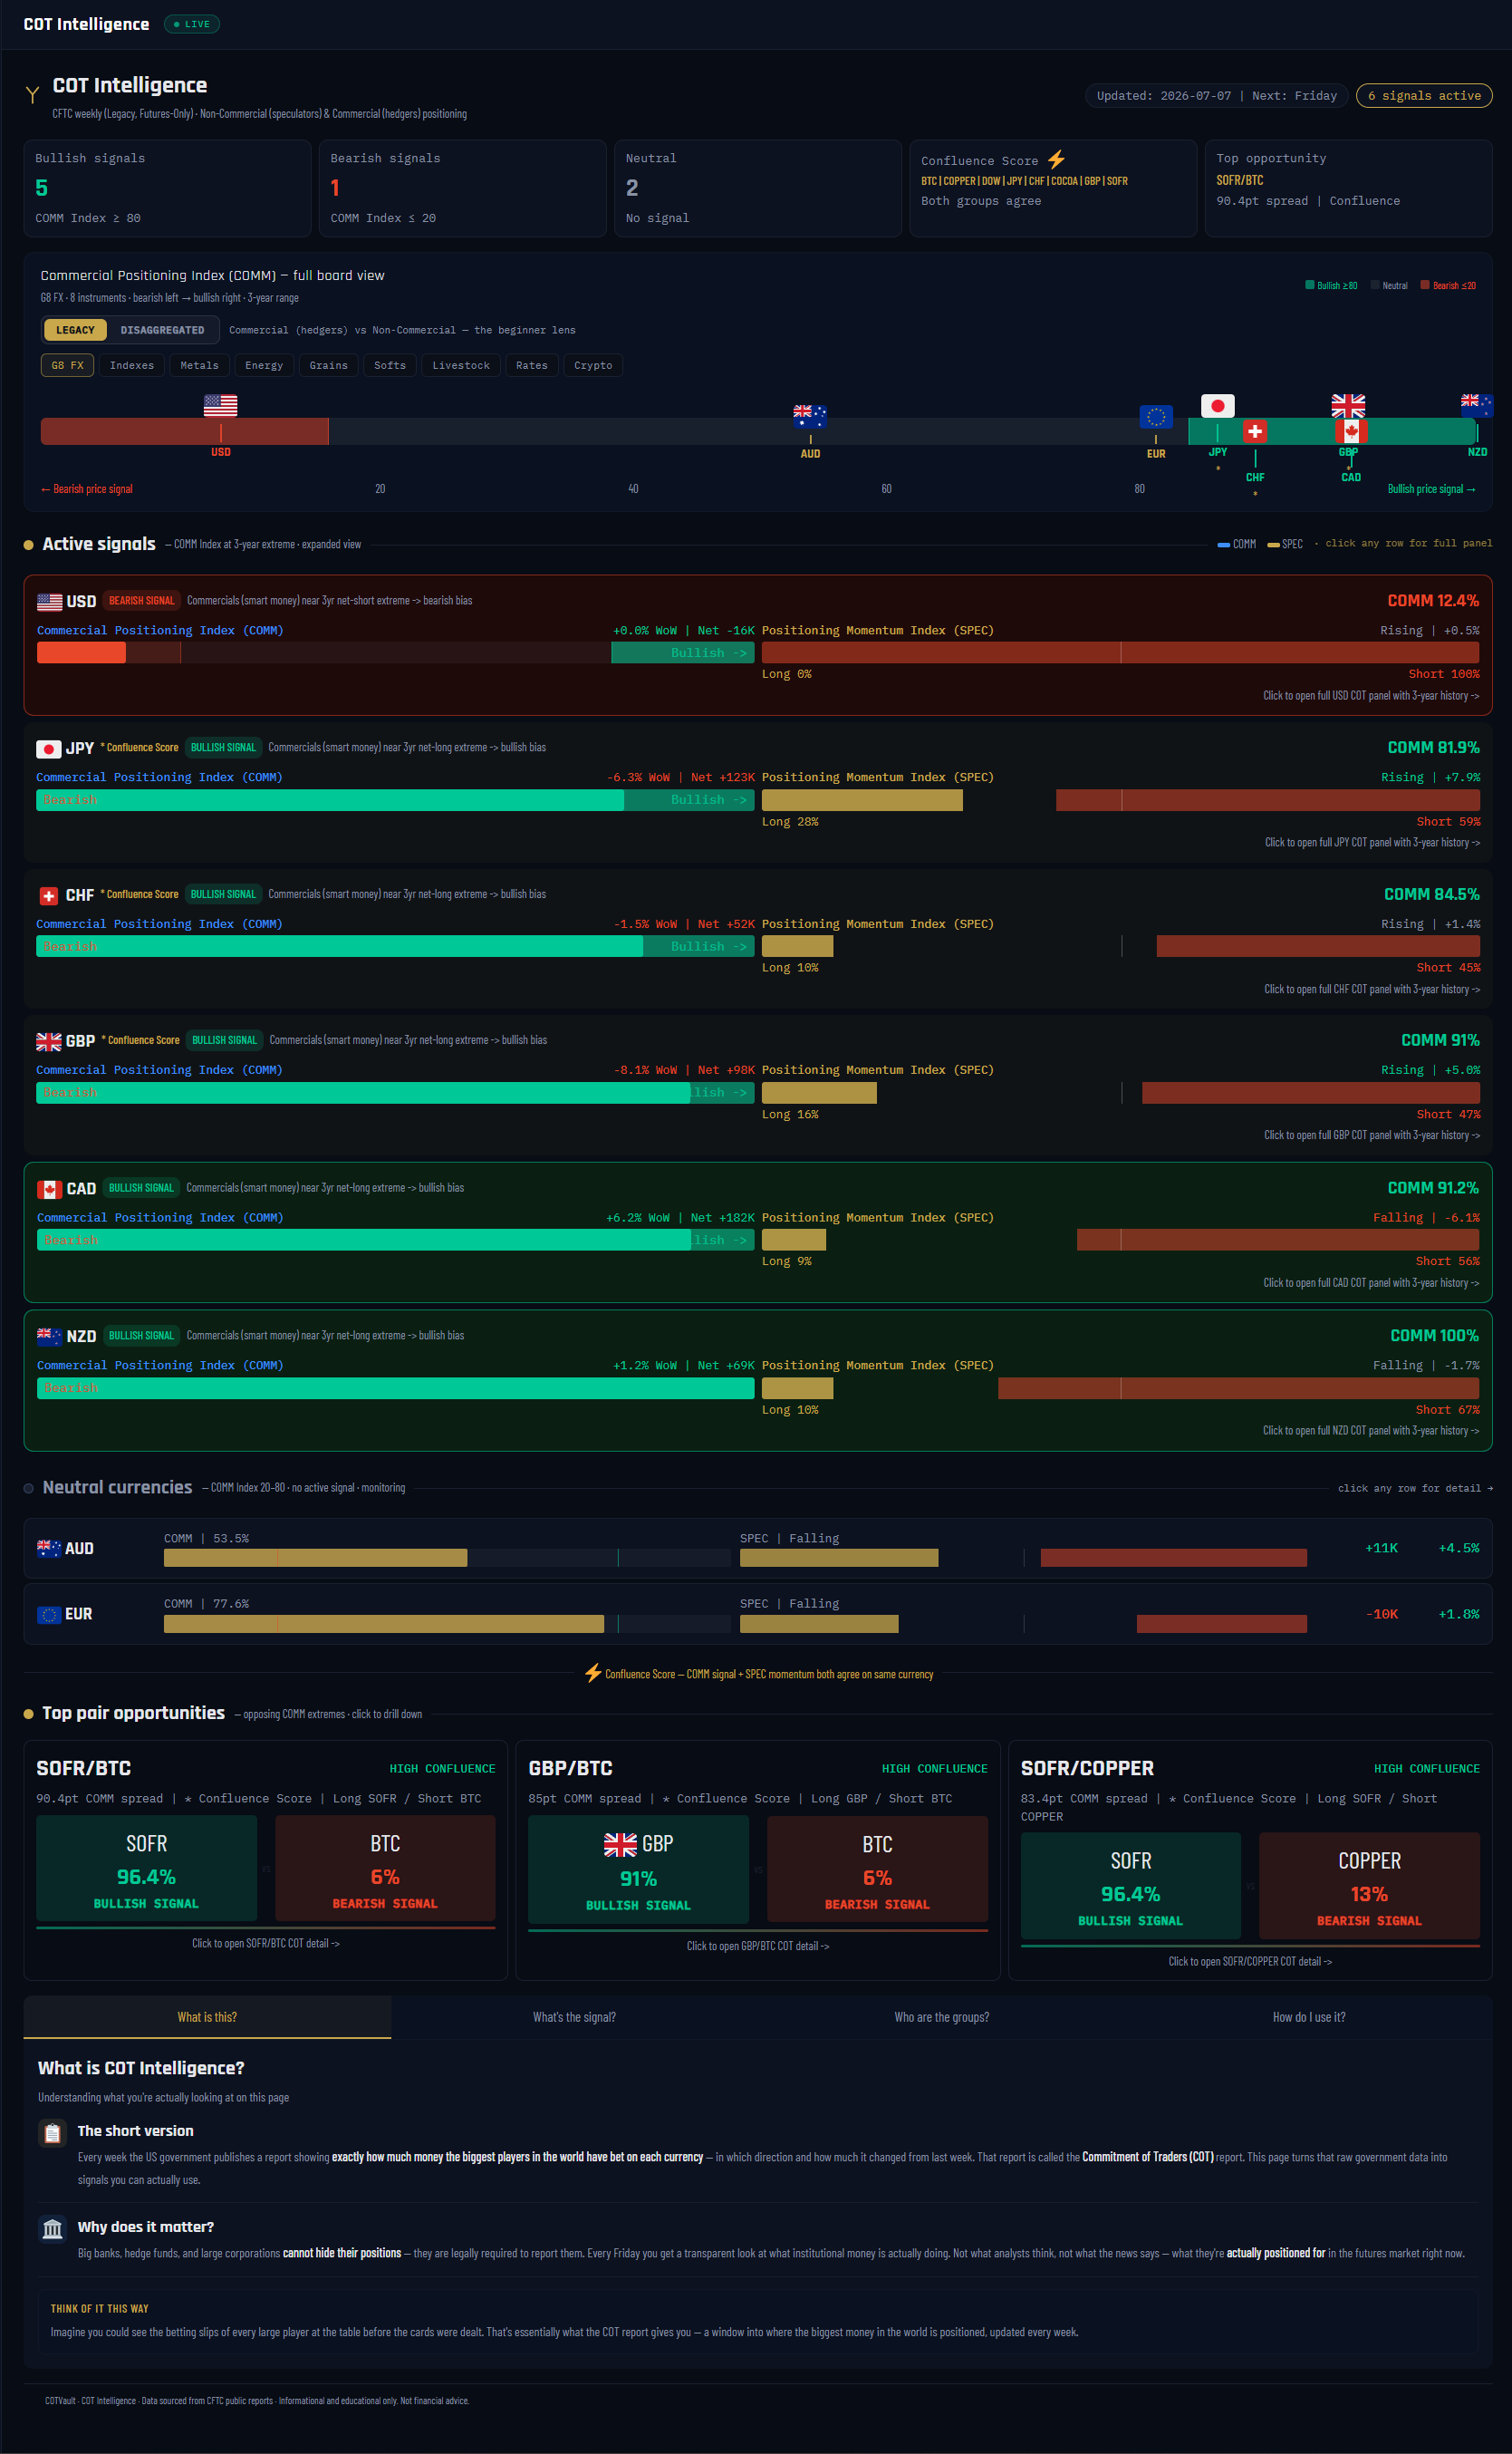
Most weeks, most currencies are noise — mid-range positioning with nothing to say. This board's job is to keep you out of those and point you at the exceptions. In the screenshot the week produced 5 bullish, 1 bearish, 2 neutral: NZD's Commercials at 100 (maximum of the 3-year range), GBP at 91, CAD at 91.2 — while USD sits at 12.4, bearish. It then does the pairing math for you: a bullish-extreme currency against a bearish-extreme one is where positioning gives a trade the widest tailwind, and those matchups are surfaced automatically with their COMM spread.
The 10-second read
Read the three counter cards, then the spectrum: flags at the far right are bullish signals, far left bearish. Anything with the ⚡ Confluence mark outranks everything else on the board.
Use it with: The COT Index (how the 0–100 number is built) ·
COT Scanner (the same week across all 47 markets) ·
Market HQ (full workup on any signal currency)
1
Panel title. The subheader states the source and both cohorts: CFTC weekly (Legacy, Futures-Only) · Non-Commercial (speculators) & Commercial (hedgers) positioning.
2
Signal counter cards. The week in three numbers — Bullish signals (COMM ≥ 80), Bearish signals (COMM ≤ 20), Neutral (everything between). In the screenshot: 5 bullish, 1 bearish, 2 neutral — an unusually loud week.
3
Confluence Score ⚡ card. Lists the currencies where the COMM signal and the SPEC momentum both point the same way. Aligned signals are the board's highest-conviction reads; unaligned ones are weaker — the hedgers are leaning but the crowd hasn't followed (or vice versa).
4
Top opportunity card. The single widest matchup on the board — in the screenshot SOFR/BTC with a 90.4-point COMM spread. The bigger the spread between one market's index and another's, the harder positioning leans into that pairing.
5
LEGACY / DISAGGREGATED toggle + class tabs. Legacy = the Commercial-vs-Non-Commercial beginner lens with the signal semantics above. Disaggregated = the specialist lens (Managed Money for commodities, Leveraged Funds for financials) shown as positioning states — EXTREME / STRETCHED / LEANING — because a speculator extreme is a crowding fact, not a buy signal. Class tabs filter the board.
6
The COMM spectrum. Every currency's flag placed along the full 0–100 range — bearish price signal on the left (≤ 20), neutral middle, bullish on the right (≥ 80). One glance shows the whole board's shape: clustered flags mean a quiet week, flags at both walls mean pair opportunities.
7
Active signals rows. Only currencies at an extreme appear here, expanded. In the screenshot USD is the lone bearish row — COMM 12.4, meaning the dollar's Commercials are nearly as net short as they've been in three years. Click any row for that currency's full COT detail panel.
8
COMM index bar + WoW + net. Each row's bar shows where the index sits in its 0–100 range with the 20/80 signal lines marked, plus the week-over-week change and the Commercials' net contract position — level, direction and size in one line.
9
SPEC Positioning Momentum bars. The speculator side of the same currency — the long/short split of Non-Commercial positions. This is the confluence check made visible: a bullish COMM signal with specs already building long earns the ⚡; specs leaning the other way means the hedgers are early and the crowd hasn't turned.
10
Neutral currencies section. Everything with COMM between 20 and 80 (AUD and EUR in the screenshot) — compressed to one line each, no signal, monitoring only. Deliberately boring: this section exists so you don't manufacture trades out of mid-range noise.
11
Top pair opportunities. Auto-surfaced matchups where one market's index is high (≥ 70) and another's low (≤ 30), ranked by spread with HIGH CONFLUENCE pairs first, each stated as "Long X / Short Y". The screenshot's leader: SOFR/BTC, HIGH CONFLUENCE. Take the pairing to your own chart — this is the wind direction, not the entry.
12
Beginner explainer tabs. Four tabs — What is this? / What's the signal? / Who are the groups? / How do I use it? — a built-in mini-course covering the report, the 80/20 thresholds, the three trader groups and the workflow, ending with the rule that governs the whole platform: COT sets the backdrop; your chart times the entry.