What it is
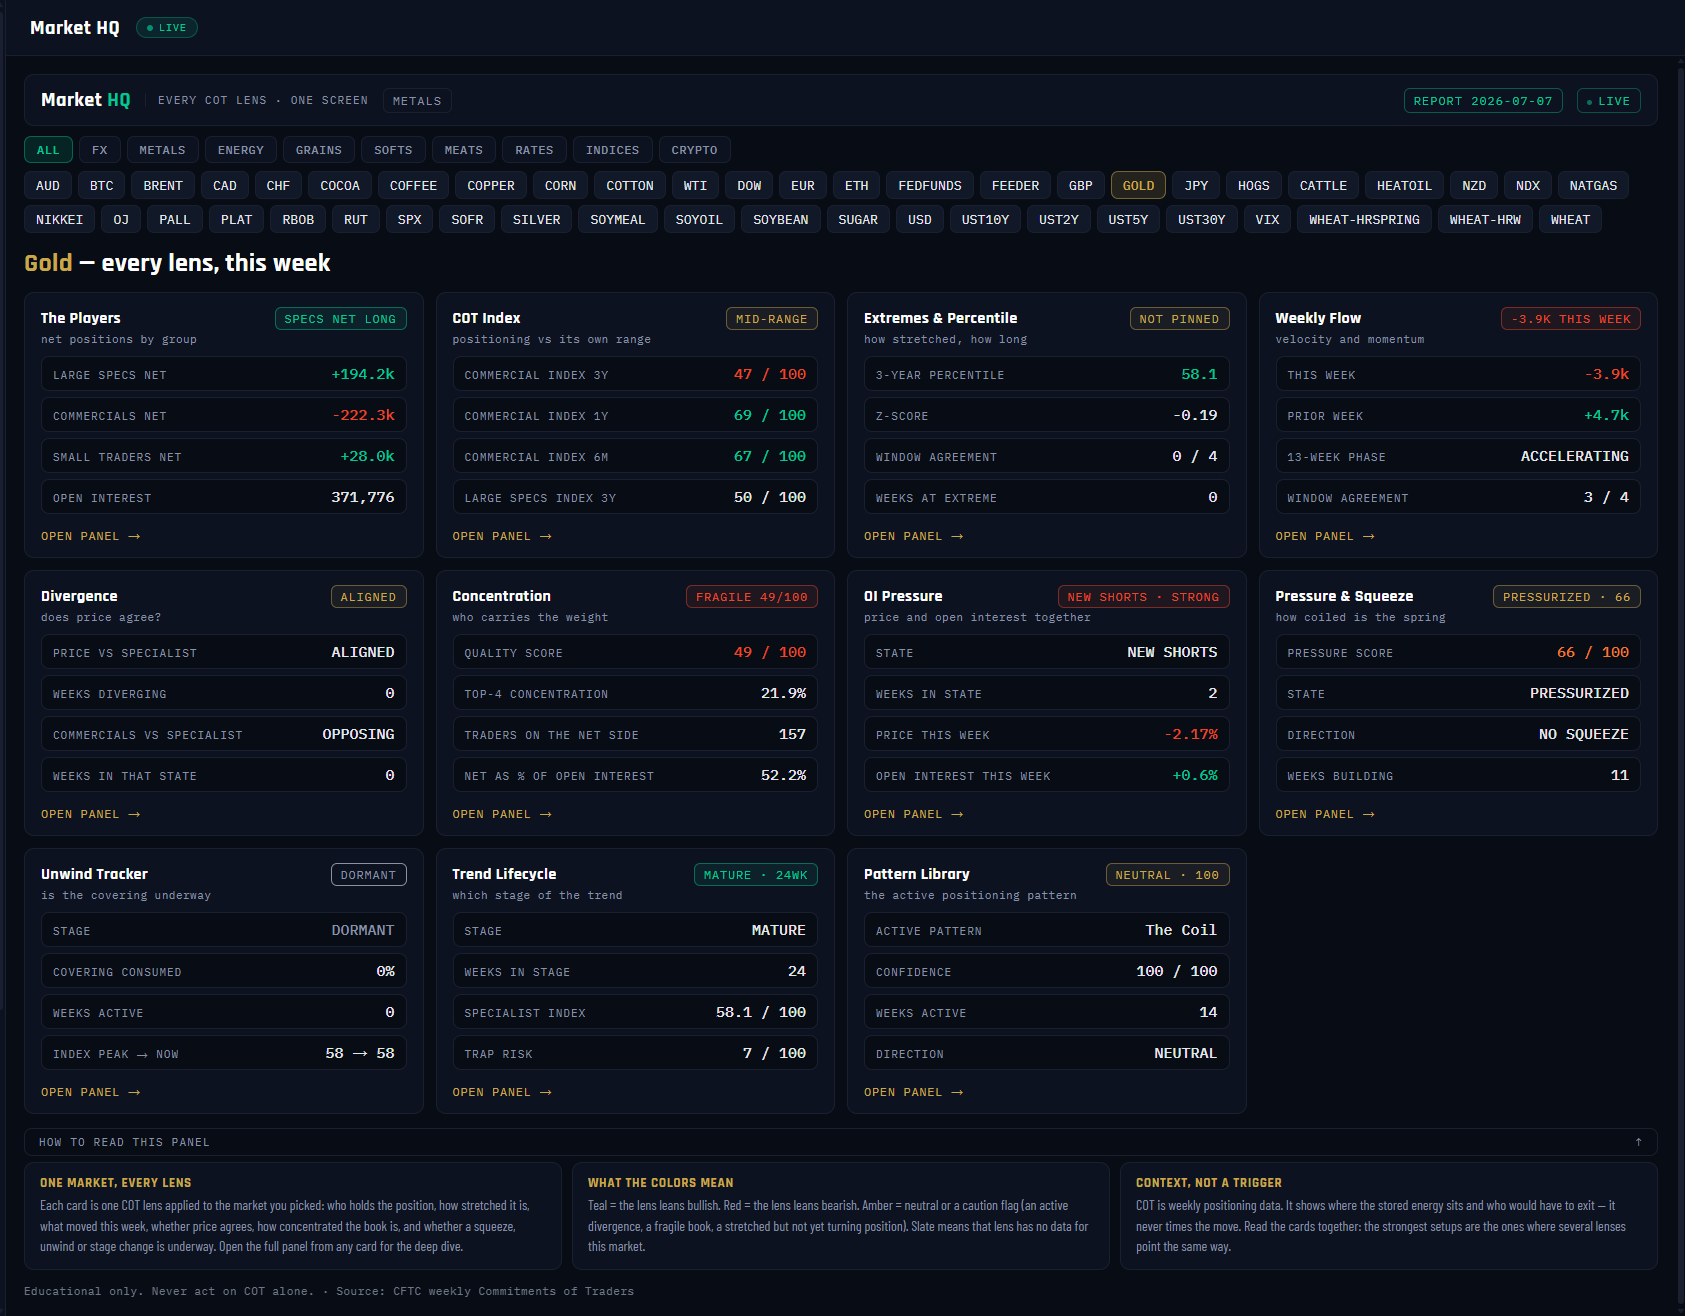
Market HQ is the one-market command center: pick any of the 47 COT markets and see all eleven analytical lenses at once — one card each for The Players, COT Index, Extremes, Weekly Flow, Divergence, Concentration, OI Pressure, Pressure & Squeeze, Unwind, Trend Lifecycle and Pattern Library. Every card carries a verdict chip, its four key numbers, and an "Open panel →" link into the full deep-dive. It's the map you read before deciding which deep panel deserves the next ten minutes.
What it measures
Nothing new — and that's the point. Each card is fed by the same canonical endpoint as its full panel, so the number on the card and the number on the deep panel are always identical. The Players card shows the three groups' net positions; the COT Index card shows the Commercial index on 3-year, 1-year and 6-month windows (0–100); Extremes shows percentile, z-score and weeks pinned; Weekly Flow shows this week's net contract change and the 13-week phase; and so on through pressure score, unwind stage, lifecycle stage and the active pattern. Eleven independent computations, one report week.
Why it's useful to you
The deep panels are powerful but there are eleven of them — opening each one for every market you're curious about doesn't scale. HQ compresses the full workup into one screen so you can triage: anything glowing teal or red is a thread worth pulling; a wall of amber and slate means a low-information week. In the screenshot, Gold reads mostly mid-range (COT Index MID-RANGE, extremes NOT PINNED, divergence ALIGNED) but three cards stand out — Concentration FRAGILE 49/100, OI Pressure NEW SHORTS, Pressure & Squeeze PRESSURIZED 66 — telling you exactly which three panels to open next.
The 10-second read
Scan the eleven verdict chips for color: teal = the lens leans bullish, red = bearish, amber = caution. Count how many point the same way, then open the panels behind the outliers.
Use it with: COT Checklist (the same read, graded and sequenced for you) ·
COT Scanner (find which market deserves an HQ visit) ·
The Players (the natural first drill-down)
1
Panel title. "Every COT lens · one screen" is the contract: eleven cards, one market, one report week. The class chip next to it names the asset class of the selected market (METALS for Gold).
2
Class chips. ALL / FX / METALS / ENERGY and the rest — filter the market grid below to one asset class before picking.
3
Market chips grid. Every market on the platform, one chip each — the selected one (GOLD in the screenshot) is highlighted. Switch markets here and all eleven cards refetch and repaint.
4
REPORT chip + LIVE. The CFTC report week every card is reading (2026-07-07). All eleven lenses are computed from the same weekly report. If a market's ingest is behind, it is marked with its own date rather than shown as current.
5
The Players card. Net positions for all three groups — Large Specs, Commercials, Small Traders — plus open interest. The verdict chip states the speculator side plainly: SPECS NET LONG in the screenshot. This is always the first card to read: whose money is where.
6
COT Index card. The Commercial positioning index on three windows — 3-year (the verdict window), 1-year and 6-month — each 0–100, with the Large Specs 3-year index for contrast. Chips: 80+ = BULLISH EXTREME, 60+ = BULLISH LEAN, MID-RANGE, 40− = BEARISH LEAN, 20− = BEARISH EXTREME. Gold reads MID-RANGE here.
7
Extremes & Percentile card. The 3-year percentile, z-score, how many of the 4 look-back windows agree, and — the chip — how many weeks positioning has been pinned at an extreme. NOT PINNED (as Gold shows) means no sustained extreme; duration only starts counting once positioning pushes past the 70th or below the 30th percentile.
8
Weekly Flow card. This week's net contract change (chip: −3.9K THIS WEEK for Gold — specs trimmed), the prior week for comparison, the 13-week phase (accelerating / trending / decelerating / reversing) and cross-window agreement out of 4.
9
Pressure & Squeeze card. The 0–100 structural-tension score with its state ladder (DORMANT → BUILDING → PRESSURIZED → CRITICAL), squeeze direction and weeks building. Gold's PRESSURIZED · 66 is the kind of amber flag HQ exists to surface — stored energy, worth the full panel.
10
Trend Lifecycle card. Which stage the positioning trend is in (EARLY / MATURE / EXHAUST / SHIFT), weeks in that stage, the specialist index and the trap-risk score. Gold: MATURE, 24 weeks in — an established trend, not a fresh one.
11
OPEN PANEL → links. Every card is a doorway: the link opens that lens's full panel with the same market selected, and a back pill returns you here. HQ summarizes; the panels explain.
12
HOW TO READ THIS PANEL. The color key (teal bullish, red bearish, amber neutral/caution, slate no data) and the standing rule: the strongest setups are the ones where several lenses point the same way — and COT is context, never a trigger.