18Concentration & Quality — Who Stands Behind the Bet
VaultSingle-market view
Nav → Intermediate → Concentration & Quality
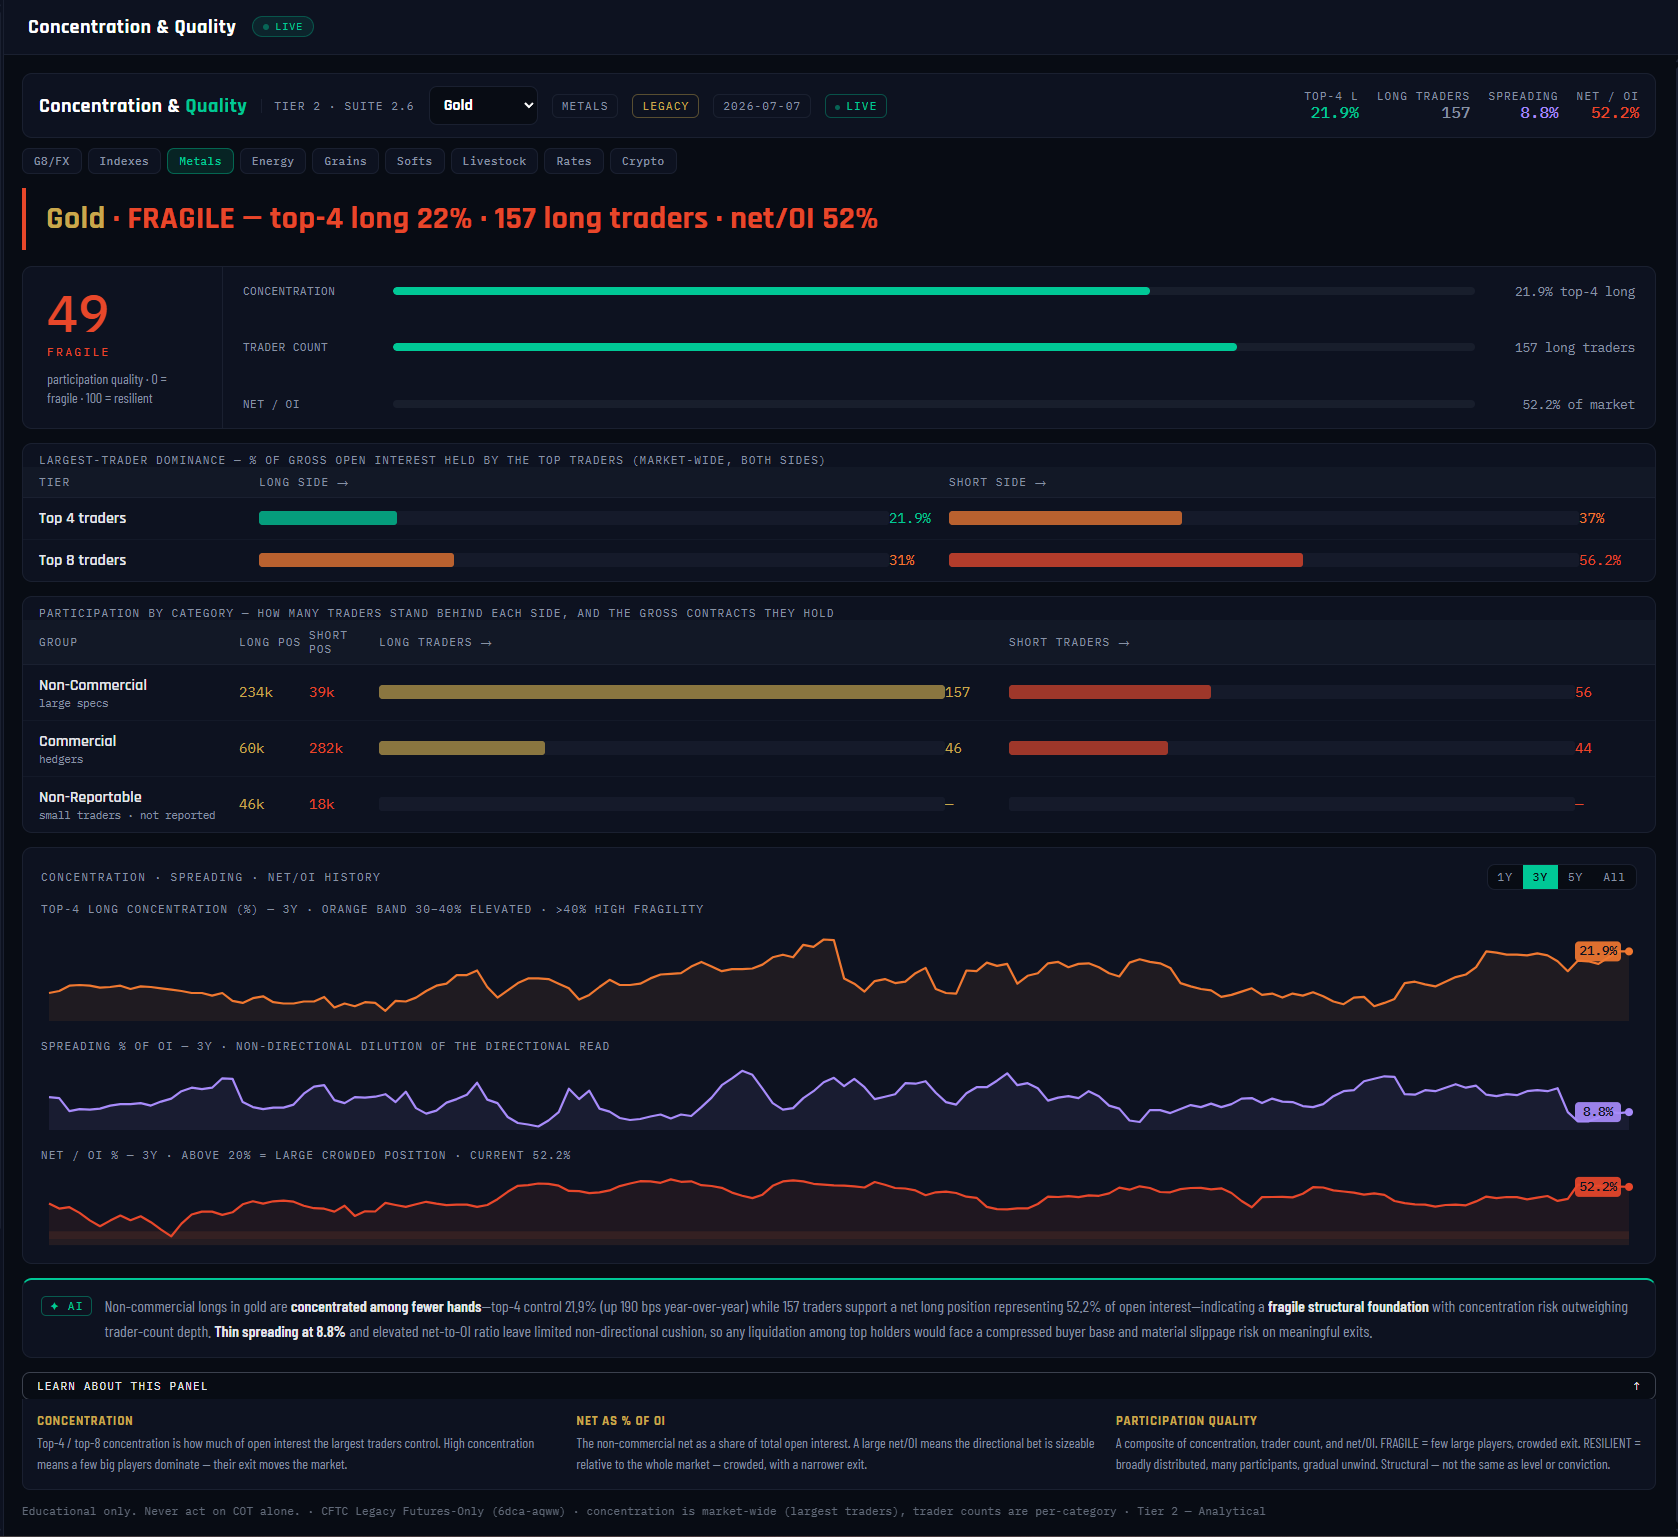
№ MAP PINS — the gold markers on this screenshot point at locations on the panel; each is explained in the legend beside it. (They are separate from the teal STEP numbers in Part 1.)
1
2
3
4
5
6
7
8
9
10
11
12
What it is
Two markets can show the identical net position — and one is a house of cards while the other is bedrock. The difference is who stands behind the bet: is it four whales or two hundred independent funds? Is the bet a rounding error against total open interest, or half the market? This panel grades the quality of participation behind the number every other panel reports.
What it measures
Three ingredients, averaged into one 0–100 quality score (0 = fragile, 100 = resilient). Concentration — the share of open interest held by the market's four largest traders, straight from the CFTC's Legacy report. Trader count — how many Large Speculators actually stand on the net side. Bet size — the net position as a percentage of total open interest. Everything anchors on the side that would have to exit: Gold's Large Specs are net long, so the panel reads the top-4 long concentration (21.9%) and the long-trader count (157). One honest caveat baked into the design: the CFTC publishes concentration market-wide only, so the per-group rows show trader counts (which are per-category) — the panel never fabricates per-group concentration.
Why it's useful to you
Because fragility decides how a position ends. Gold scores 49 — FRAGILE in the screenshot: the top-4 share is moderate, but the net bet is a huge 52.2% of open interest, so most of the market is already leaning one way. A fragile book doesn't predict a reversal — it predicts the character of one: when a concentrated, oversized bet unwinds, there's little depth to absorb it and the move is violent. A resilient book (many traders, small bet, low concentration) unwinds gradually. Same COT extreme, very different risk.
The 10-second read
Read the dial: RESILIENT (70+) = deep, distributed book; FRAGILE (below 50) = narrow exit. Then check net/OI — above roughly 20% the bet is oversized for its market.
Use it with: Pressure & Squeeze (is the fragile book also under tension?) ·
Unwind Tracker (has the fragile exit started?) ·
Market HQ (this quality score as one card among eleven)
1
Panel title + market dropdown. Concentration & Quality · Tier 2 · Suite 2.6, on Gold. This panel always reads the CFTC Legacy report — concentration and trader counts live there.
2
Stat chips. TOP-4 L 21.9% · LONG TRADERS 157 · SPREADING 8.8% · NET/OI 52.2%. The four raw facts the quality score is built from.
3
Verdict banner. "FRAGILE — top-4 long 22% · 157 long traders · net/OI 52%." One line, the whole story: the crowd is broad, but the bet is enormous relative to the market.
4
Quality score dial. Gold reads 49. The ladder: FRAGILE below 50, MODERATE 50–69, RESILIENT 70+. An average of the three component scores beside it.
5
Component bars. The three ingredients scored 0–100: concentration (lower top-4 share = higher score), trader count (more traders = higher), and net/OI (smaller bet = higher). See which one is dragging the grade — for Gold it's the bet size.
6
Largest-trader dominance. Top-4 and top-8 gross concentration, long side vs short side — the CFTC's own whale-watch numbers. A lopsided pair (heavy on one side only) tells you which side the whales are carrying.
7
Participation by category. Gross longs/shorts and trader counts for Non-Commercial (157 long traders in Gold), Commercial (46) and Non-Reportable — the Small Traders, whose counts the CFTC doesn't collect.
8
Top-4 concentration history. The net-side top-4 share over time (21.9% now). A rising line means the position is migrating into fewer hands — quality decaying even if the net never moves.
9
Spreading % history. Non-directional spread positions as a share of OI (8.8%). High spreading dilutes every directional read — it's volume that takes no side.
10
Net/OI % history. The bet as a share of the whole market — 52.2% now, and the chart marks the ~20% line above which a bet counts as crowded. Gold is far beyond it.
11
AI analysis. Two sentences: the read (what the quality data shows), then the risk — here, that the position is concentrated among fewer hands, a fragile foundation.
12
Education cards. CONCENTRATION / NET AS % OF OI / PARTICIPATION QUALITY — the full lesson behind each metric, one click away.