What it is
Every deep-dive panel reads one market at a time. The Cross Index turns the lens sideways: it takes the specialist COT Index of every market in a class and lines them up on one matrix, ranked most bullish → most bearish. In one glance you see which markets the professional speculators have pushed to an extreme, which are merely leaning, and — the panel's signature move — where two correlated markets sit at opposing extremes at the same time.
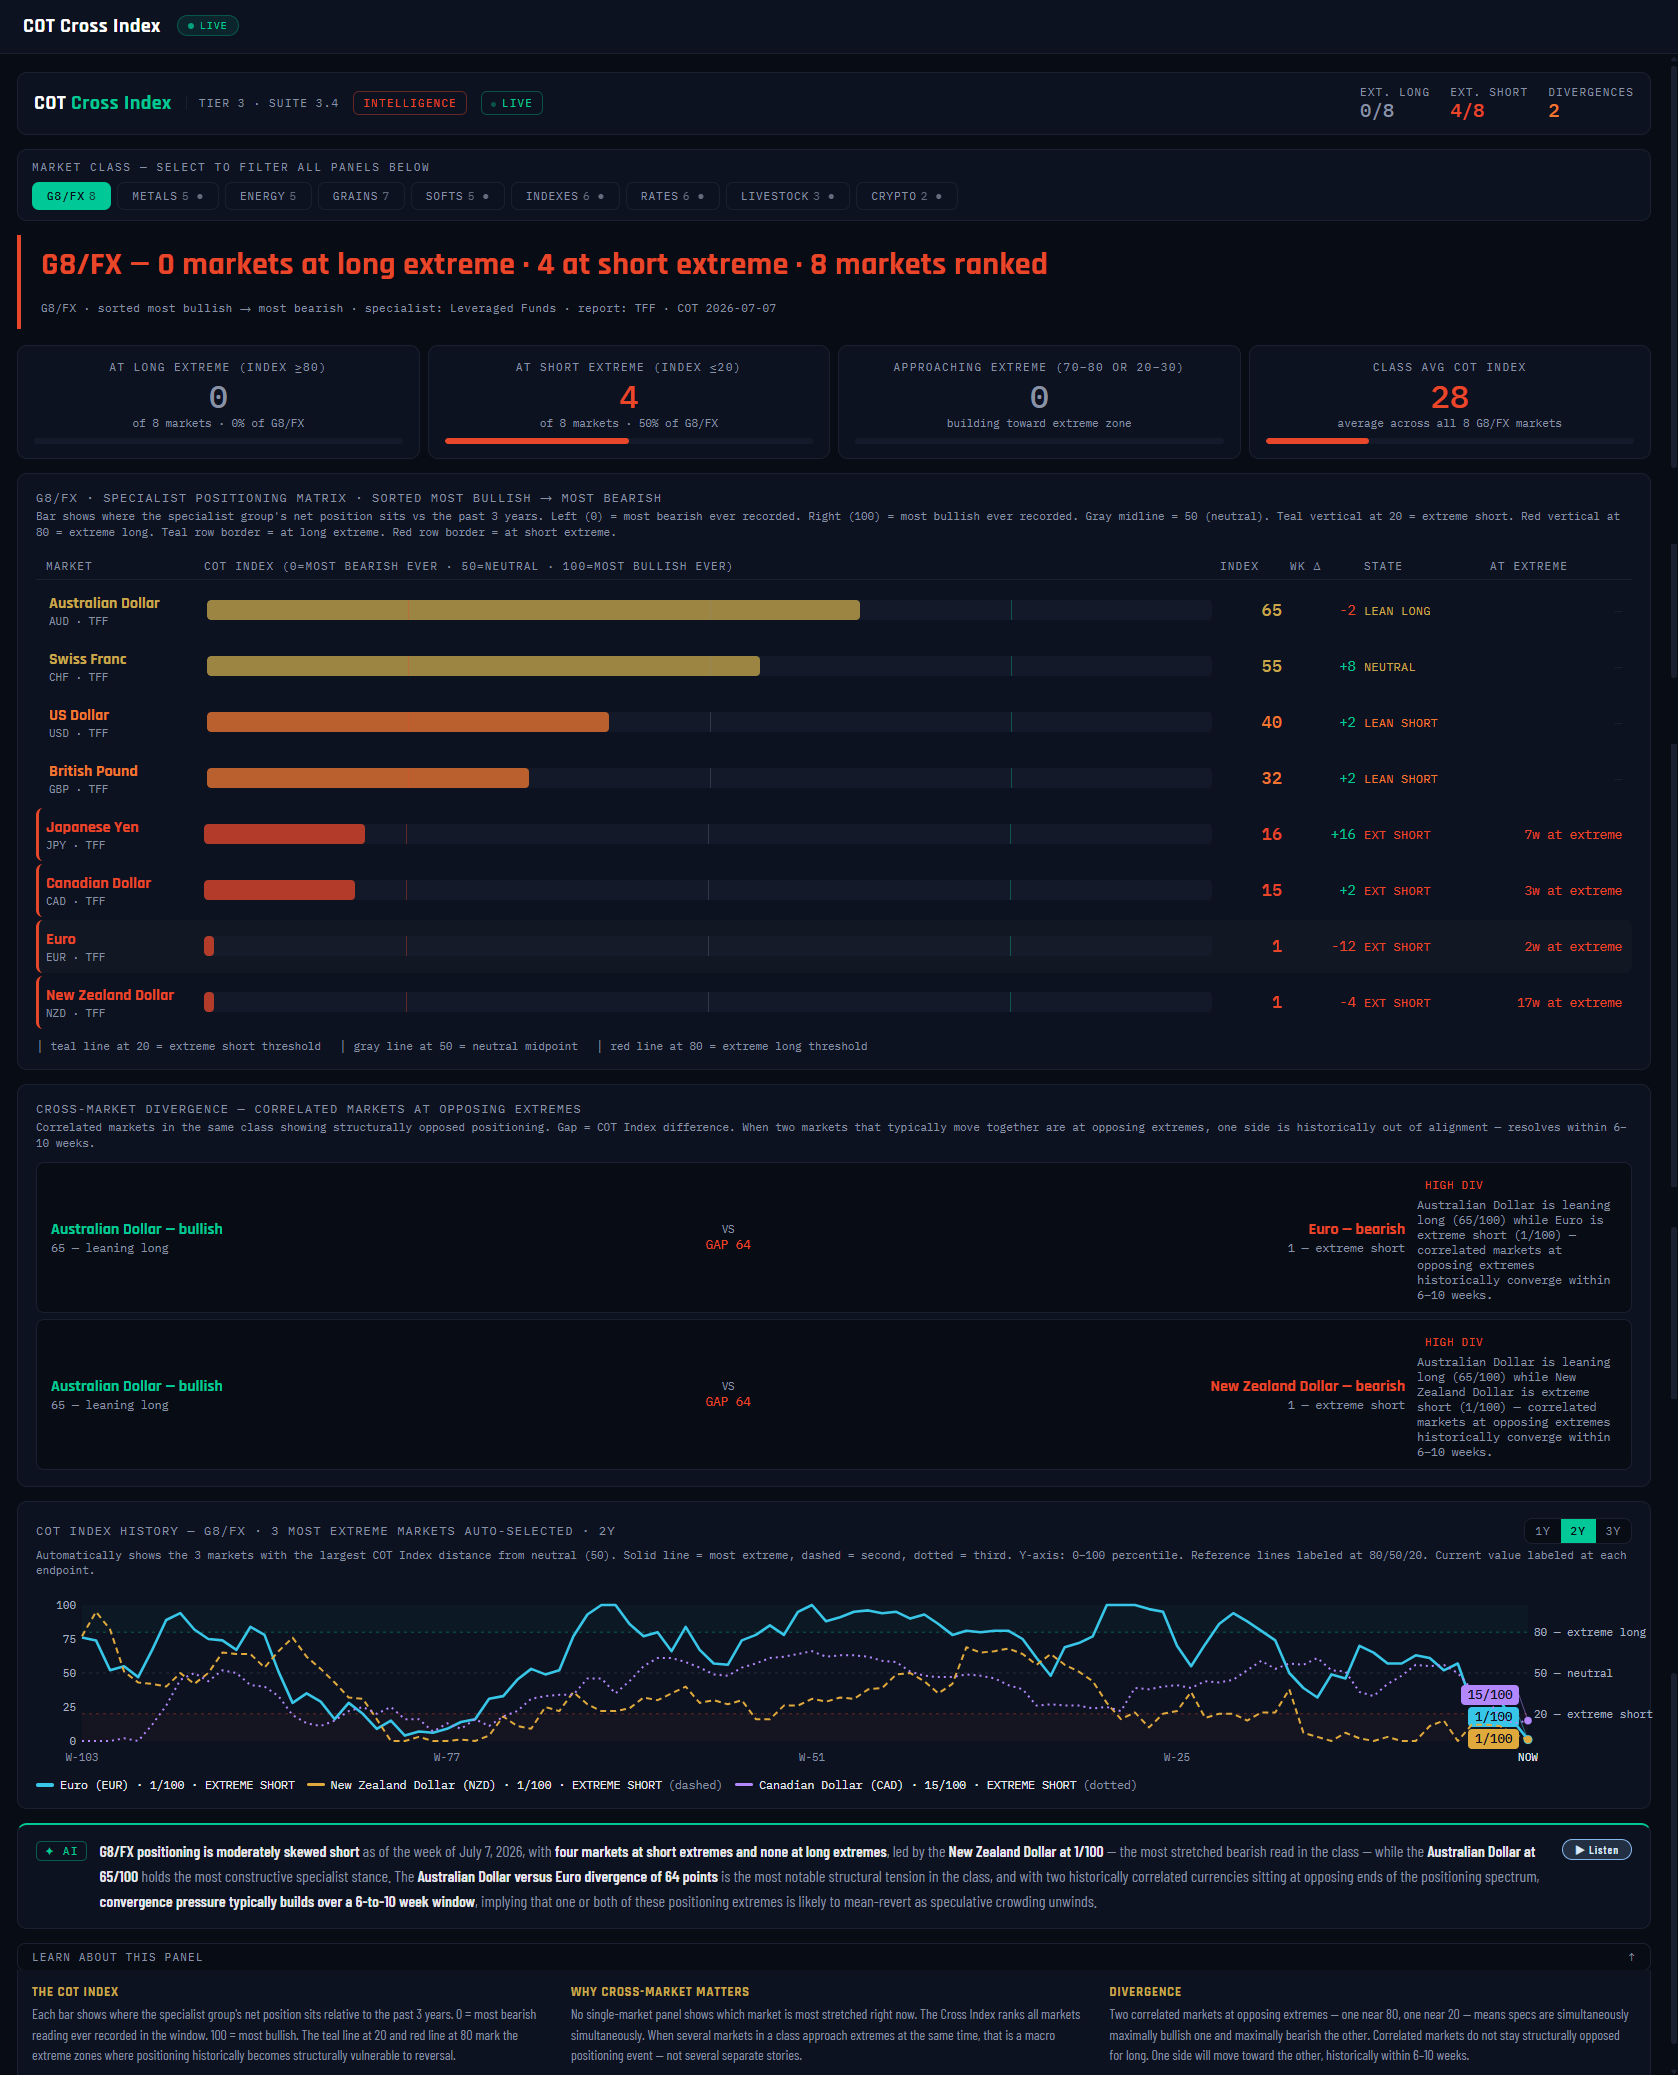
For FX that last part matters more than anywhere else: the CFTC only reports dollar-denominated contracts, so no report exists for a cross like AUDNZD. Put the two currencies' indexes side by side, though, and the gap between them is the institutional read on the cross — on this screenshot, AUD at 65 against NZD at 1 is a 64-point gap, flagged as a HIGH divergence.
What it measures
Each bar is that market's specialist index: where the specialist group's net position sits inside its past 3 years, scaled 0–100 (100 = most net-long in three years, 0 = most net-short). "Specialist" means the group with the strongest track record for each report family — Managed Money on Disaggregated markets (metals, energy, grains…) and Leveraged Funds on TFF markets (FX, indexes, rates). The state ladder runs EXTREME (≥80 or ≤20) → STRETCHED (70s / 20s) → LEANING (above 55 / below 45) → NEUTRAL. A divergence card fires when a correlated pair shows a gap of 30+ points with one side at 65+ and the other at 35 or below; a gap of 50+ earns HIGH DIV.
Why it's useful to you
Positioning numbers mean little in isolation — 65 is only interesting because everything around it reads 1. Ranking a whole class on one scale gives you relative stretch, which is what cross and spread trades actually run on. And the divergence cards do the pair-hunting for you: correlated markets do not stay structurally opposed for long — historically these gaps converge within 6–10 weeks. That's not a timing signal, but it tells you which cross deserves a spot on the watchlist this week.
The 10-second read
Header chips first: how many markets sit at a long or short extreme. Then the top and bottom of the matrix. Any HIGH DIV card is the week's cross idea — vet it, don't trade it.
Use it with: Extremes Screener (the same hunt across ALL classes, with the commercial leg added) ·
Divergence Detection (does price agree with either leg?) ·
Market HQ (drill into any market that's pinned)
1
Class stat chips. The headline census for the selected class — here G8/FX: EXT. LONG 0/8, EXT. SHORT 4/8, DIVERGENCES 2. Half the FX board pinned at a short extreme is itself the story, before you open a single market.
2
Market-class filter. G8/FX, Metals, Energy, Grains, Softs, Indexes, Rates, Livestock, Crypto — one click re-ranks every section below for that class.
3
Verdict banner. The class read in one sentence: "G8/FX — 0 markets at long extreme · 4 at short extreme." Skewed counts like this mean the extreme is a class-wide theme (here: specialists short most of the FX board), not a single-market quirk.
4
Summary cards. At long extreme / at short extreme / approaching (the 70s and 20s — next week's candidates) / class average index. The average (28 here) anchors what "normal" looks like for this class right now.
5
Matrix columns. INDEX (the 0–100 number), WK Δ (this week's change), STATE (the ladder word) and AT EXTREME (how many consecutive weeks pinned). Weeks-at-extreme is the underrated column — a fresh extreme and a 15-week-old one are different animals.
6
Top of the matrix. AUD at 65, LEAN LONG — the most bullishly positioned market in the class. Note it's not even STRETCHED: in a board this bearish, "most bullish" is relative.
7
Specialist positioning matrix. Every market in the class on one 0–100 scale, sorted most bullish → most bearish. Bar length and color follow the index; this is the panel's core graphic.
8
Bottom of the matrix. NZD and EUR at 1/100 — EXT SHORT, red-bordered, with their weeks-at-extreme counts. Specialists are about as net-short these currencies as they have been in three years.
9
Cross-market divergence cards. Correlated pairs at opposing extremes — AUD (65, leaning long) vs EUR (1, extreme short), GAP 64 · HIGH DIV, and the same against NZD. For FX pairs this is the synthetic cross read the CFTC never publishes.
10
COT Index history chart. The three most extreme markets in the class, auto-selected, with their index paths overlaid — so you can see whether today's extreme is a fresh arrival or a long-running pin.
11
AI note + Listen. The AI read of the class — which extremes and divergences matter this week, in plain English. The Listen button reads it aloud.
12
Education bar. The COT Index / Why cross-market matters / Divergence — the panel's built-in course, collapsed by default. One click if any term above is fuzzy.