What it is
The panel's on-screen title is "Crowding Meter" — under the hood it is a tension meter between two specific cohorts of the Legacy COT report: the Commercials (the hedgers, historically the informed side that buys weakness and sells strength) and the Small Traders (non-reportables — mostly retail, the crowd that tends to be maxed out at exactly the wrong moment). It scores how hard the crowd is currently leaning against the commercials, and turns that stand-off into a single 0–100 contrarian score with a state ladder: SPARSE → ELEVATED → CROWDED → EXTREME.
What it measures
Four components feed the score: retail exposure (where the small traders' net position sits in its 3-year range), commercial opposition (how hard the commercials are positioned against the crowd's side), velocity divergence (the two groups actively moving in opposite directions this week — the live tug-of-war), and duration (how many weeks the crowding has persisted, measured against a ~6-week historical norm). Four alert conditions sit on top — retail at extreme, commercial opposing, velocity diverging, open interest confirming — and the count of flagged conditions is the panel's honesty check on its own score.
Why it's useful to you
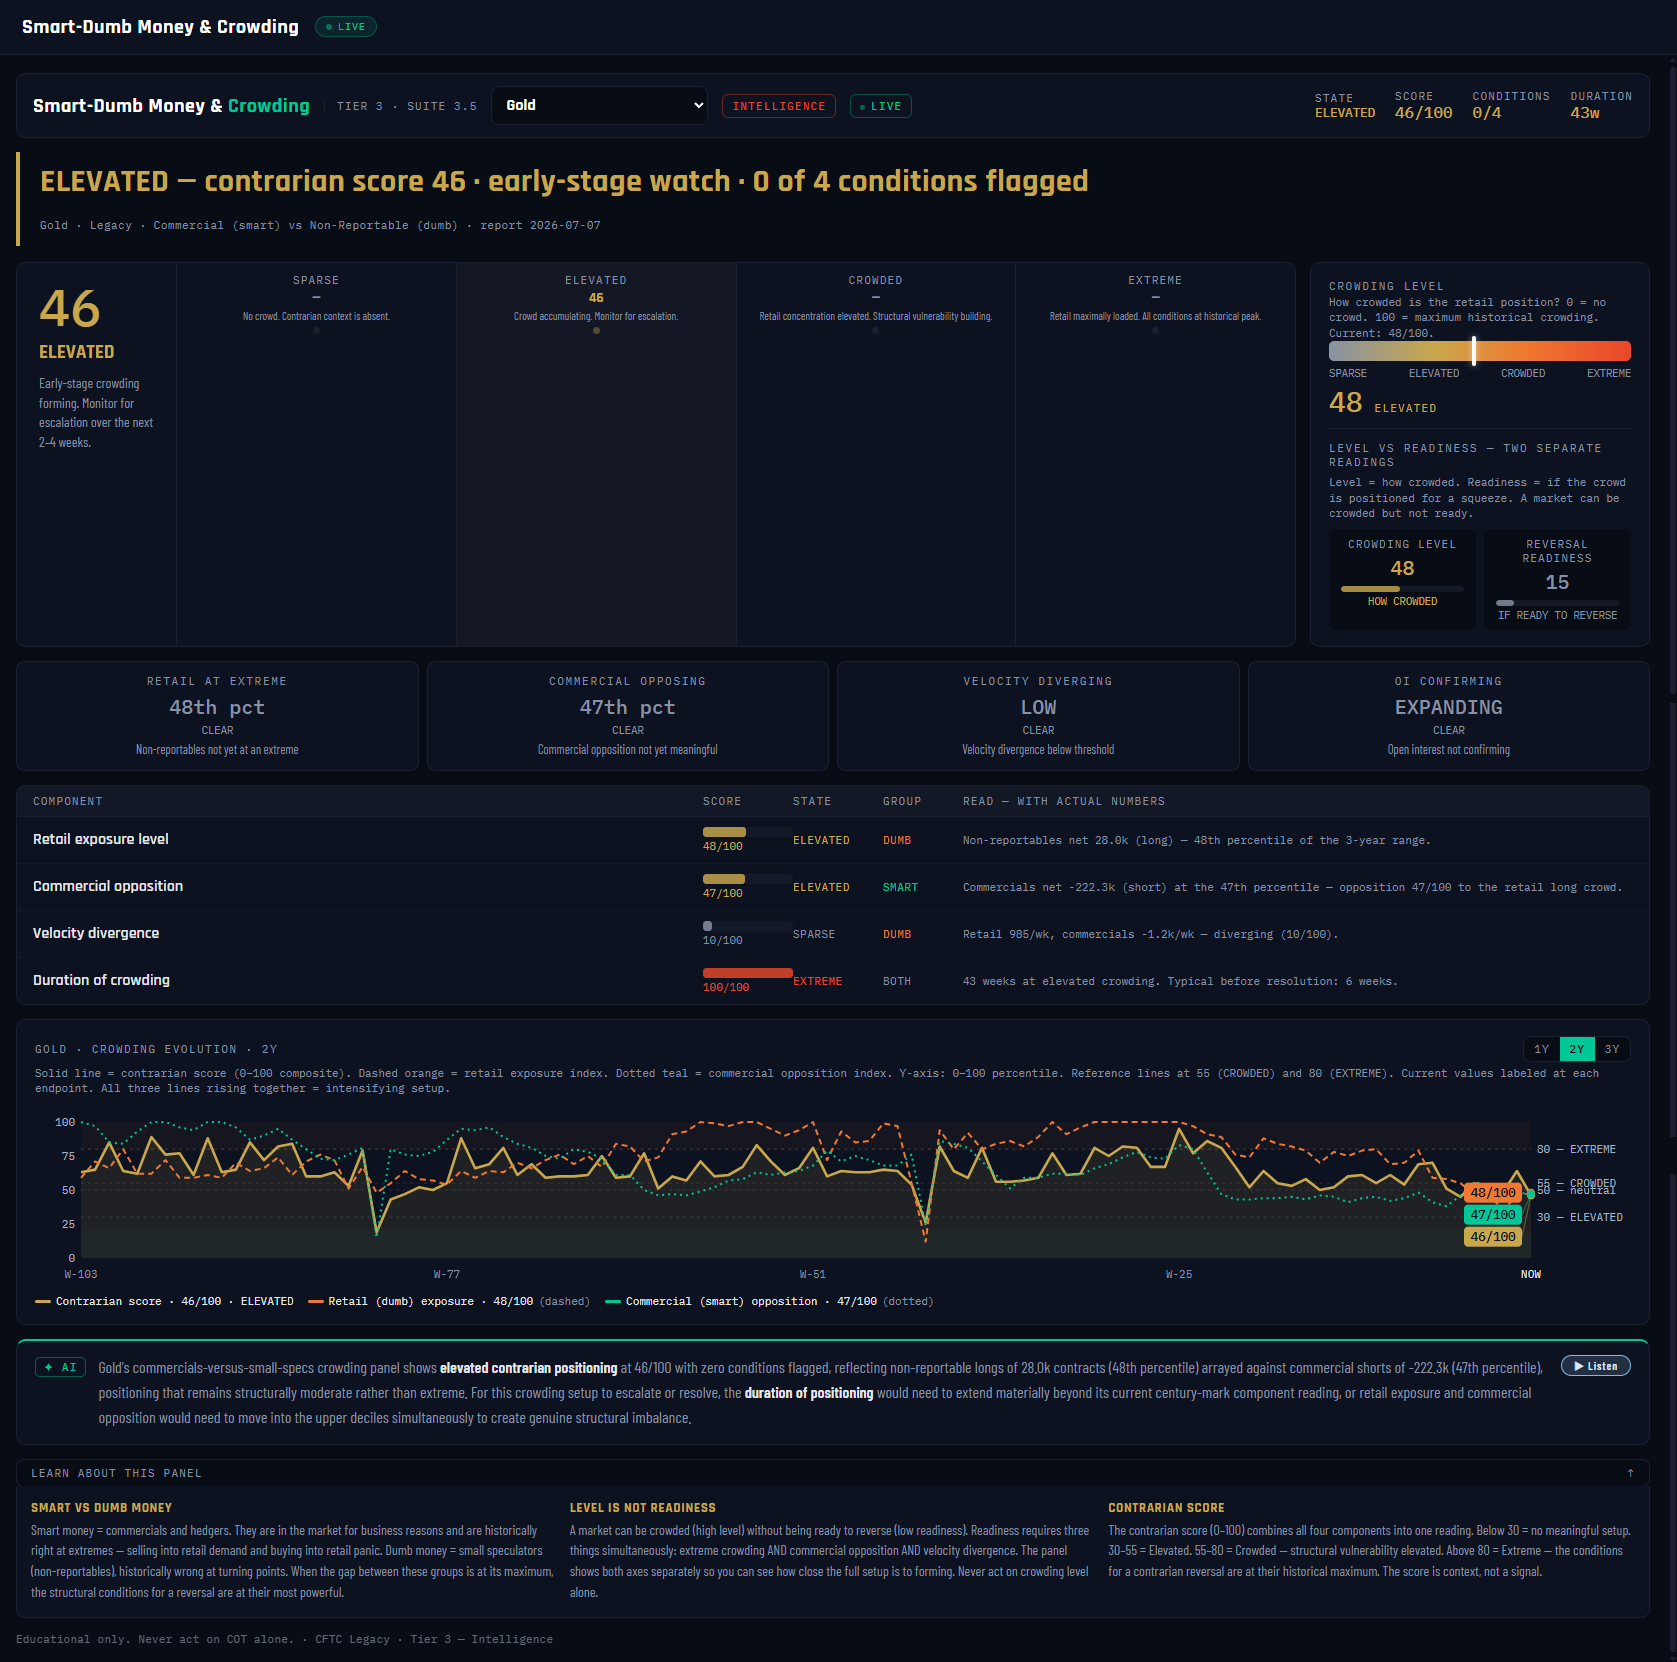
Because crowd-fading is the most abused idea in trading. Retail-heavy positioning is a real, documented headwind — but a crowded market can stay crowded for months. This panel enforces the discipline with two laws. Level is not readiness: the crowding level (how packed the trade is) and reversal readiness (whether it's primed to unwind) are separate readings — on this screenshot Gold shows level 48 but readiness just 15, i.e. somewhat crowded, nowhere near turning. Trajectory over snapshot: the evolution chart shows whether the setup is building or bleeding off — the direction of the score matters as much as its value.
The 10-second read
State chip + conditions count. ELEVATED · 0 of 4 conditions = a watch file, nothing more. It gets interesting when the state hits CROWDED with 2–3 conditions flagged and readiness climbing.
Use it with: Pressure & Squeeze (the commercials-vs-professional-specs spring — the other tension axis) ·
Unwind Tracker (has the release actually begun?) ·
Extremes & Percentile (the raw percentile evidence under the crowd reading)
1
Title + market dropdown. Single-market panel — pick any of the covered markets (Gold here). Runs on the Legacy report: commercials vs non-reportable small traders.
2
Stat chips. STATE ELEVATED / SCORE 46/100 / CONDITIONS 0/4 / DURATION 43w. The 43-week duration with zero conditions flagged tells you this is a long, slow lean — not a coiled reversal setup.
3
Verdict banner. The one-sentence read: "ELEVATED — contrarian score 46 · early-stage watch · 0 of 4 conditions." Always score + stage + condition count, so you can't mistake a watch file for a setup.
4
Contrarian score readout. The headline 0–100 number (46). It blends retail exposure, commercial opposition, velocity divergence and duration — a structure reading, never a timing signal.
5
State ladder. SPARSE → ELEVATED (46, current) → CROWDED → EXTREME. Deliberately different vocabulary from the Pressure gauge's DORMANT→CRITICAL ladder — this one describes crowd level, not release readiness.
6
Crowding level meter. 48/100 — purely how packed the small traders' side is versus its own 3-year history, before any other component is considered.
7
LEVEL VS READINESS split. The panel's first law made visual: crowding level 48 (HOW crowded) beside reversal readiness 15 (IF ready to reverse). A high level with low readiness means the trade can keep grinding on — fading it early is how contrarians lose money.
8
Condition cards. The four tripwires with live values: retail at extreme (48th pct — clear), commercial opposing (47th), velocity diverging (LOW), OI expanding. Each flips to flagged at its own threshold; the flagged count drives how seriously to take the score.
9
Component table. Every input with its 0–100 value and a plain-English read using actual contract numbers — retail exposure 48, commercial opposition 47, velocity divergence 10, duration 100 (43 weeks vs the ~6-week norm). Duration maxed while everything else idles is the signature of a stale, not explosive, crowd.
10
Crowding evolution chart. The contrarian score with the retail and commercial component lines over the past years — the second law in action. Rising into an extreme is a building setup; drifting sideways at 46 is background noise.
11
AI analysis + Listen. Two sentences from the AI analyst: the state, score and flagged conditions with the real contract numbers, then what would have to happen for the score to escalate or resolve.
12
Education cards. The cohort definitions, "Level is not readiness" and the contrarian-score method — the panel's built-in course if any reading above needs unpacking.