27Crowding Evolution — Level vs Readiness, Over Time
VaultSingle-market view
Nav → Advanced → Crowding Evolution
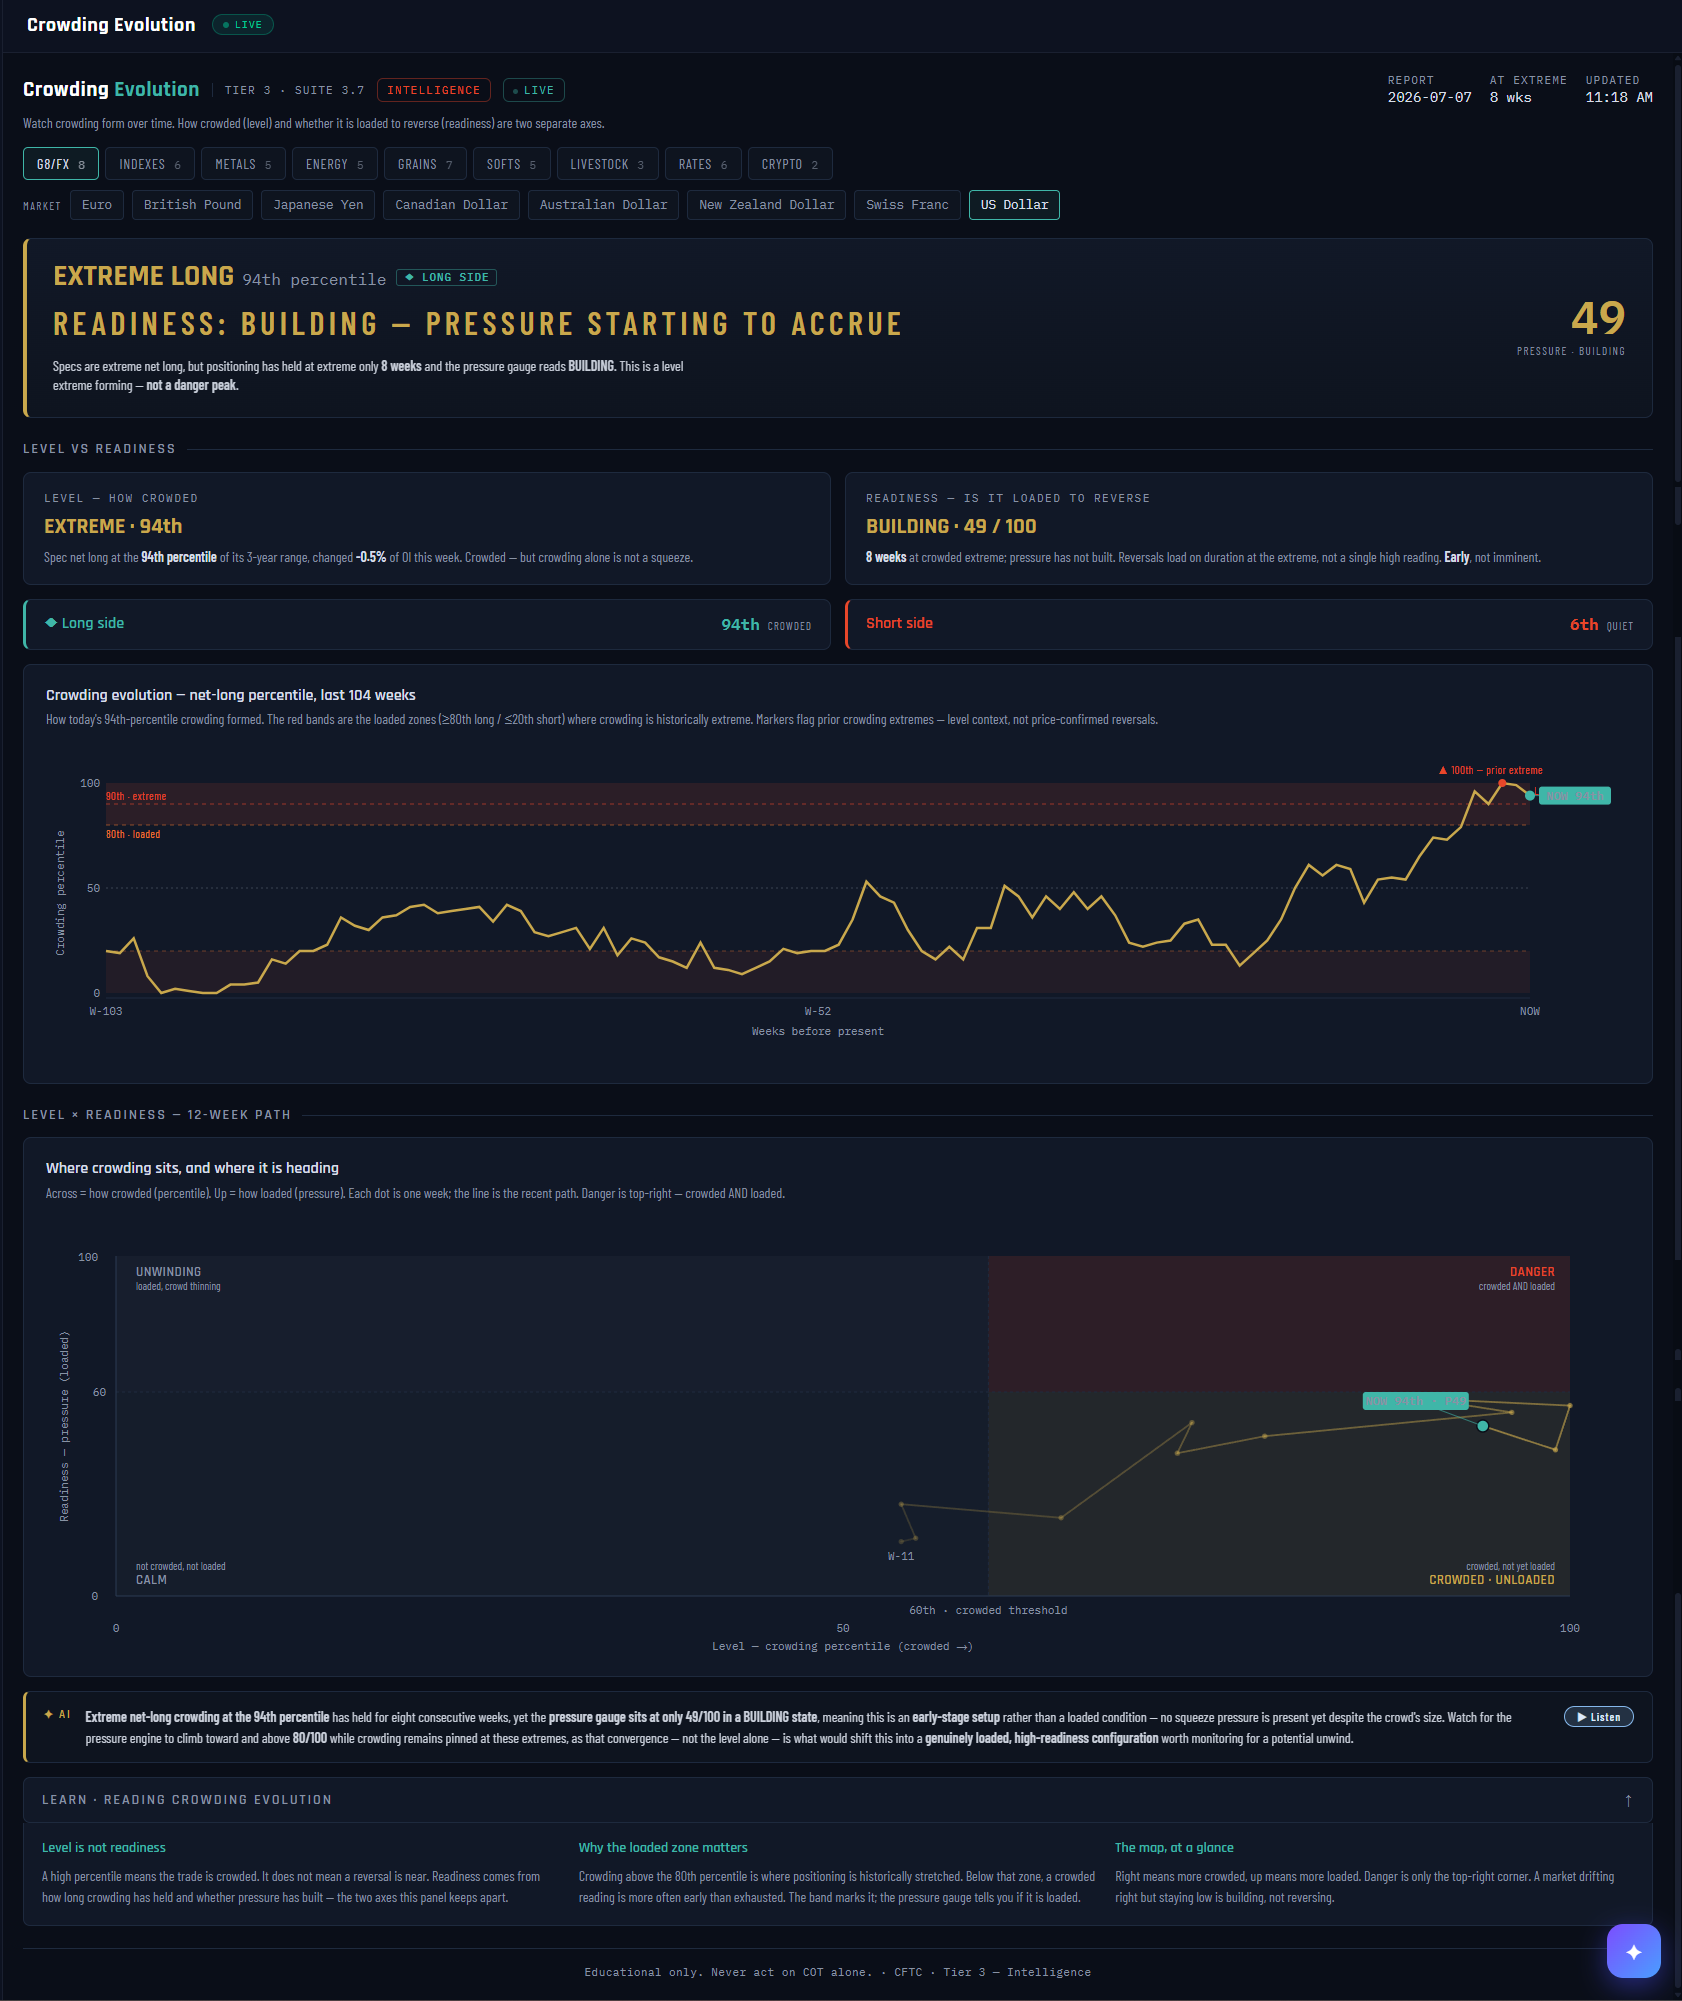
№ MAP PINS — the gold markers on this screenshot point at locations on the panel; each is explained in the legend beside it. (They are separate from the teal STEP numbers in Part 1.)
1
2
3
4
5
6
7
8
9
10
11
What it is
The time-lapse of crowding. Where the Crowding panel gives you this week’s photograph, Crowding Evolution runs the film: how today’s crowd formed, how long it has held, and — the panel’s core teaching — whether it is actually loaded to reverse. Its two axes are deliberately kept apart: Level (how crowded) and Readiness (is it loaded).
What it measures
Level = the crowd’s net position as a percentile of its 3-year range — the screenshot shows the US Dollar at the 94th percentile, EXTREME LONG. Readiness = a 0–100 pressure gauge built from how long crowding has held at the extreme and whether squeeze pressure has accrued — here just 49, BUILDING, after 8 weeks at the extreme. Same market, two very different answers: crowded, but not yet loaded.
Why it's useful to you
The most expensive mistake in contrarian trading is shorting a crowd that isn’t finished. This panel exists to prevent exactly that: a 94th-percentile reading alone is a level, not a trigger. Reversals load on duration at the extreme plus pressure, and the path map shows you drifting toward the danger corner — or not — week by week.
The 10-second read
Read the verdict banner’s two lines: the LEVEL line tells you if there’s a crowd; the READINESS line tells you whether it’s early, building, or genuinely loaded. Danger is only when both scream.
Use it with: The Crowding panel ·
Pressure & Squeeze ·
Unwind Tracker
1
Header + report chips. The report week, how many weeks the market has sat at its extreme, and the last update time.
2
Class + market selector. All asset classes; the screenshot has the US Dollar selected.
3
The verdict banner. Level in the headline (EXTREME LONG · 94th percentile), readiness in the sub-line (BUILDING — pressure starting to accrue), and the pressure score on the right. This banner is the whole panel in three lines.
4
LEVEL card. How crowded: the crowd’s percentile, this week’s change, and the reminder the panel lives by — crowding alone is not a squeeze.
5
READINESS card. Is it loaded: weeks at the extreme and the pressure state. Reversals load on duration, not on a single high reading.
6
Long side / short side strips. Both sides ranked at once — here the long side is 94th, CROWDED while the short side sits at the 6th percentile, QUIET.
7
Evolution chart — 104 weeks. How today’s crowding formed. The shaded bands are the loaded zones (≥80th long / ≤20th short); markers flag prior crowding extremes for context.
8
Level × Readiness path map. Each dot is one week: right = more crowded, up = more loaded. The line is the recent 12-week path — you can watch a market drift toward danger.
9
The DANGER corner. Top-right only: crowded AND loaded. The screenshot’s dot sits right of center but well below the corner — crowded, unloaded, early.
10
AI read. The analyst’s synthesis of both axes — here flagging an early-stage setup and naming the exact condition (pressure through 80 while crowding stays pinned) that would change the verdict.
11
LEARN strip. The panel’s three lessons in miniature — level is not readiness, why the loaded zone matters, and how to read the map.