What it is
The proof layer. Every other panel tells you what positioning looks like today; the Edge Lab tells you what each COT signal has actually been worth — every historical firing across the whole market universe since 2006, measured forward. Six core signals sit on the scoreboard: commercial net-long and net-short extremes, specialist washout and crowded-long, and small-trader extremes on both sides. Each gets a letter grade, and losers get an F printed right next to the winners.
What it measures
For each signal, the lab finds every week it fired historically and measures the price move over the next N weeks, in the direction the signal implies. The test is built not to flatter: entry is the week AFTER the report week (COT publishes days after the record date — no lookahead), each extreme episode counts once (the first week it fires, so a 10-week pin doesn't inflate the sample), outliers are trimmed with standard quant hygiene, and the result is compared against baseline drift — the universe's own average N-week move. Beating zero isn't an edge; beating drift is. Grades: A = avg ≥ +2.0% with a hit rate ≥ 58%, B ≥ +1.0%, C ≥ +0.3%, F below that — and no grade at all under 12 trades.
Why it's useful to you
Because signal worship is how retail accounts die. "Commercials at an extreme" sounds authoritative — the Edge Lab tells you it wins about 59% of the time for a ~+2.7% average over 13 weeks, which is a real but modest edge, with plenty of losing trades and losing years inside it. Honest base rates recalibrate everything: you size smaller, you stop expecting every extreme to reverse, you lead with the A/B signals and treat F-graded folklore as the warning it is. A graduated trader weights conviction by evidence, not by which chart looks exciting.
The 10-second read
Scan the GRADE column. B and above = reads worth building a process on; F = reads to stop repeating. Then click your favorite signal and look at its losing years before you fall in love.
Use it with: Extremes Screener (which markets fire the graded signals right now) ·
COT Triggers (fresh firings, the week they happen) ·
Extremes & Percentile (the index behind every backtested entry)
1
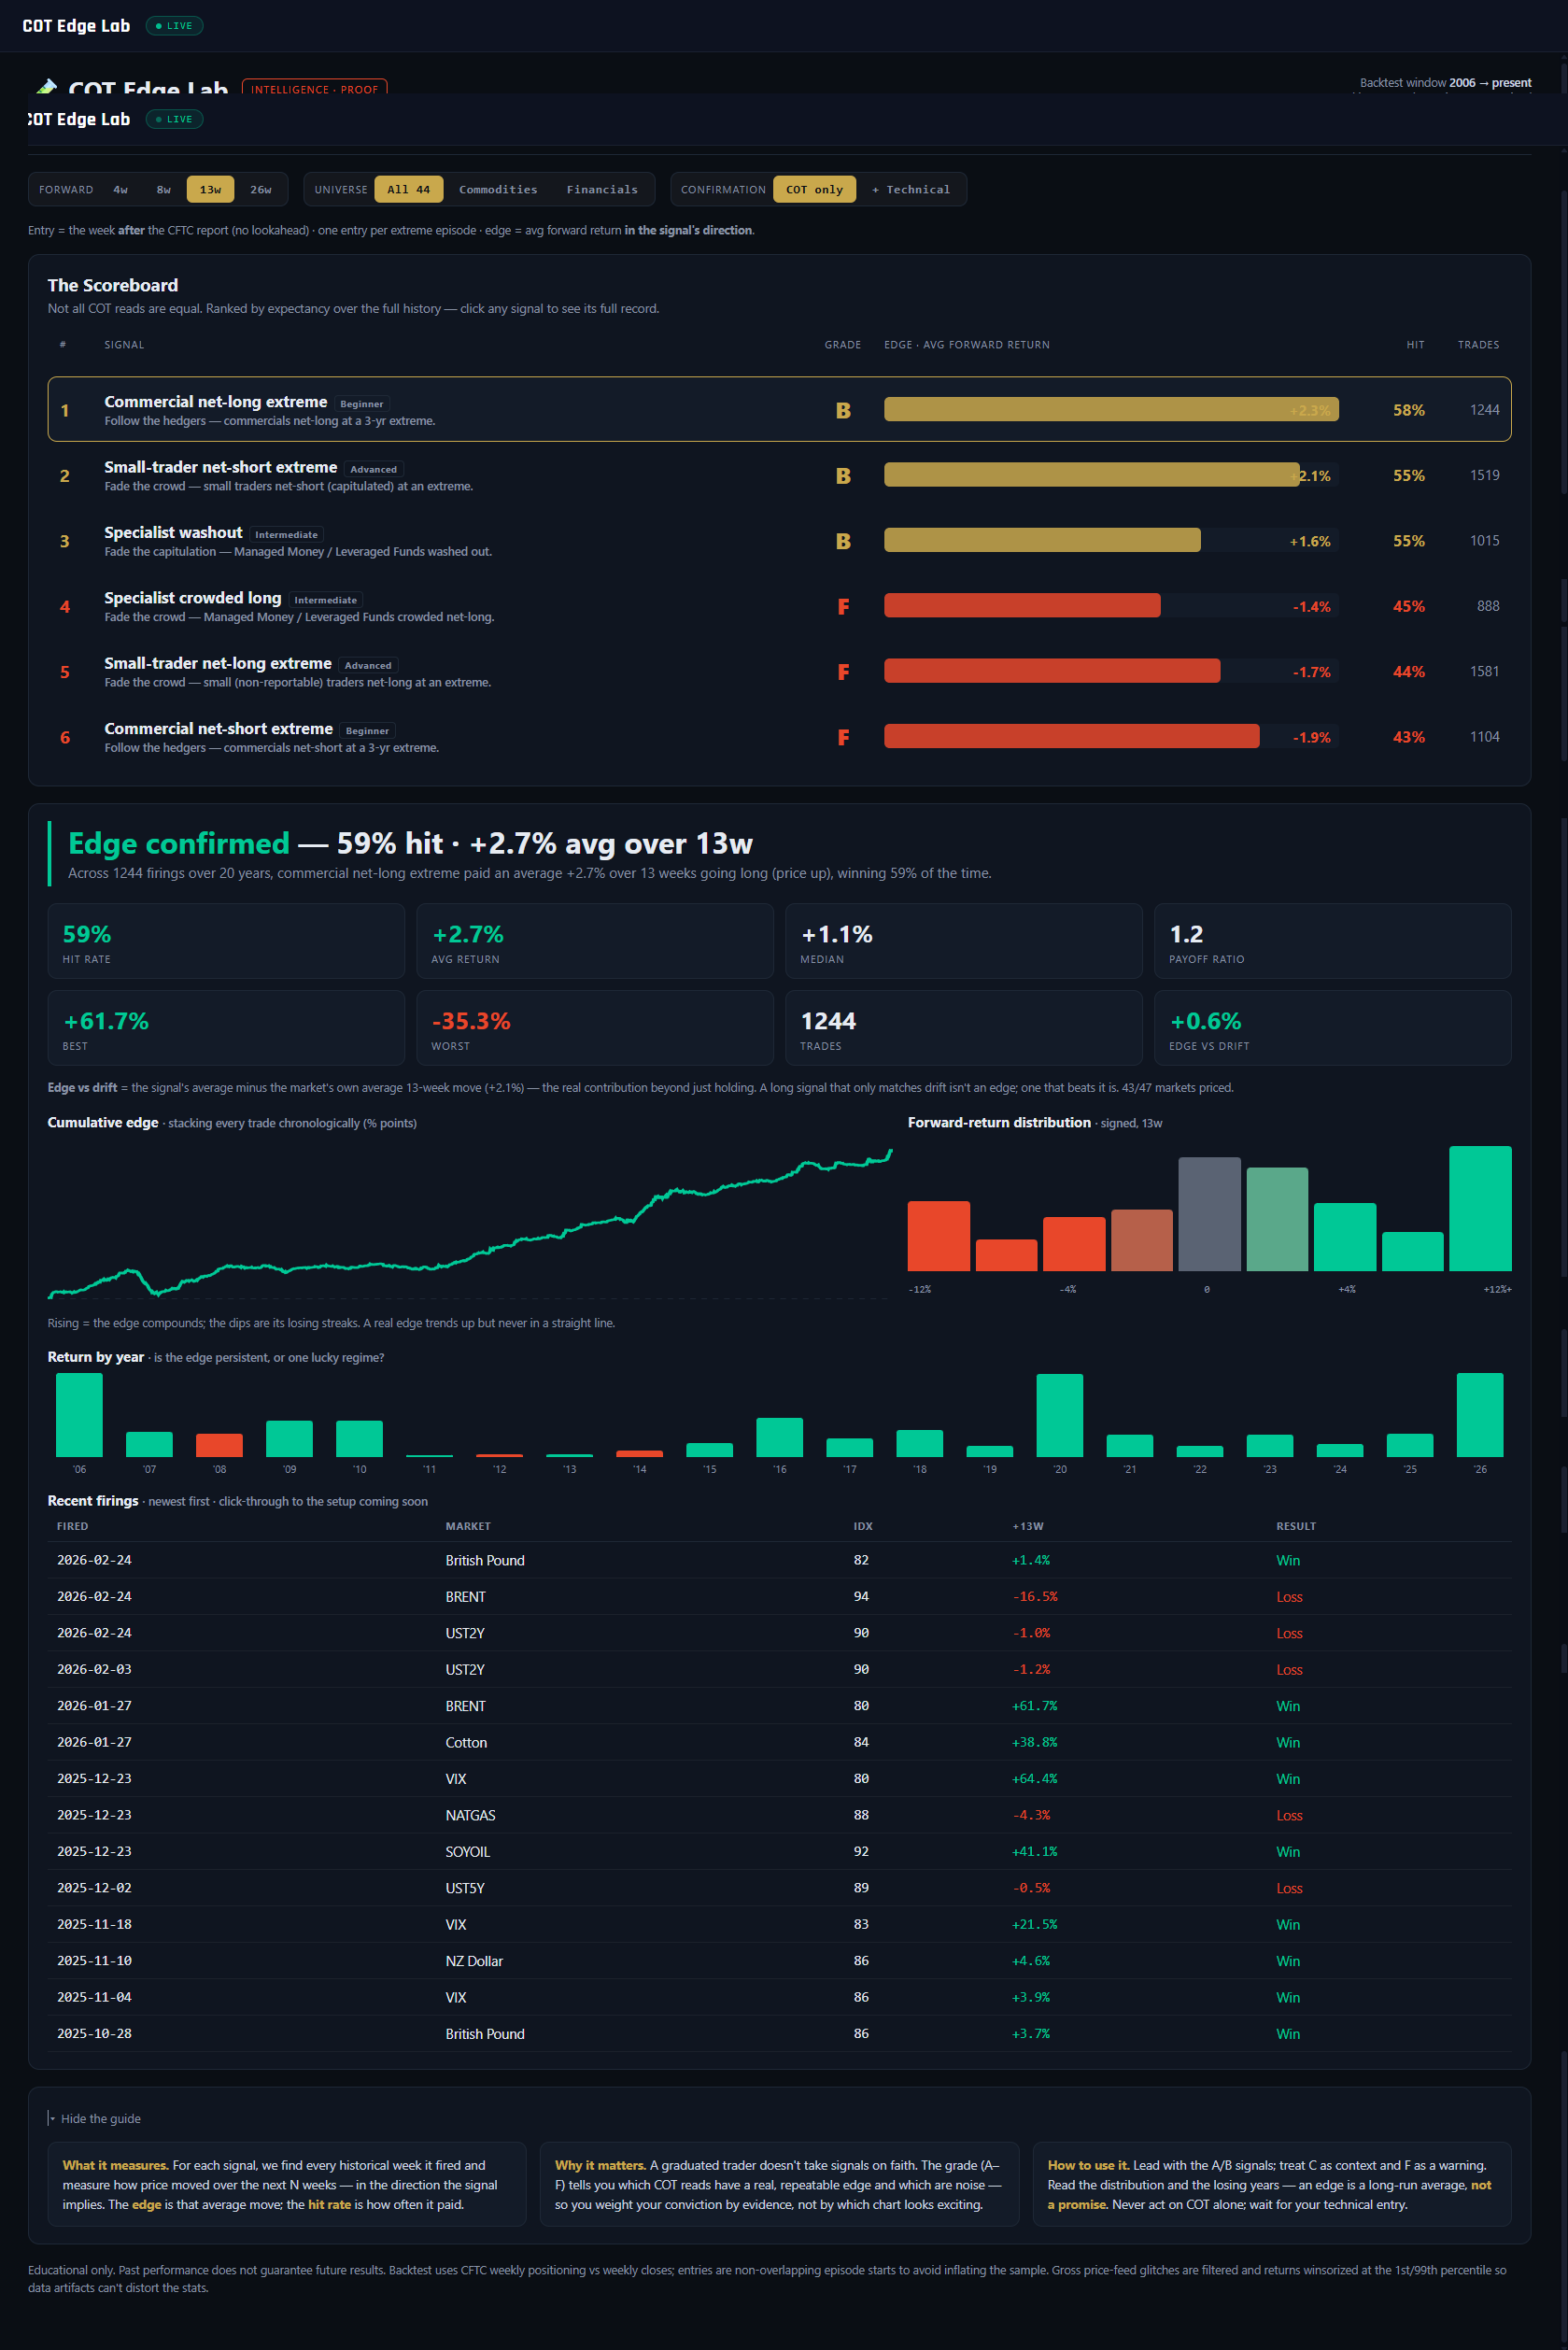
FORWARD window. 4w / 8w / 13w / 26w — how far ahead each trade is measured. COT edges are slow; the same signal can grade differently at 4 weeks and 26. The screenshot runs the 13-week window.
2
UNIVERSE toggle. All 44 markets, Commodities only, or Financials only. Some signals earn their grade in commodities and lose it in financials — check both before trusting a read in your market class.
3
CONFIRMATION toggle. COT only = take every firing. + Technical = only count firings where price momentum over the prior 8 weeks already agrees with the signal — the platform's "let the chart confirm the COT bias" rule, backtested. Compare the two to see what waiting for confirmation is worth.
4
GRADE column. The letter verdicts, A–F. On this screenshot the board splits B / B / B / F / F / F — half the platform's own signals fail the test, and the panel says so. That honesty is the product.
5
EDGE bar column. Average forward return per firing, drawn as a bar — teal right of zero, red left. The visual answer to "how much is this signal actually worth?"
6
Scoreboard row. One row per signal: thesis, grade, average edge, hit rate, trade count. Row 1 — Commercial net-long extreme: grade B, +2.3% average, 58% hit rate, 1,244 trades. Click any row to open its full tearsheet below.
7
Stat tiles. The selected signal in full: hit rate, average and median return, payoff ratio, best and worst trade, trade count, and edge vs drift — the only tile that proves the signal beats simply holding the market.
8
Cumulative edge curve. Every historical trade stacked in sequence. A healthy edge climbs unevenly with visible drawdowns; a curve that only ever rises should make you suspicious, and this one doesn't pretend.
9
Return distribution. The histogram of all forward returns. Note how much of the mass sits left of zero even for a B-graded signal — an edge is a shifted distribution, not a guarantee.
10
Return by year. The persistence check: average return per calendar year since 2006. Every real edge has losing years — knowing they exist in the backtest is what keeps you in the strategy when one happens live.
11
Recent firings table. The latest actual entries — date, market, index at firing, the forward move, win or loss. The bridge between the aggregate statistics and trades you can recognize on a chart.
12
Guide cards. What it measures / Why it matters / How to use it: lead with A/B signals, treat C as context, read F as a warning — and remember an edge is a long-run average, not a promise about the next trade.