31Extremes Screener — The Radar for Stretched Positioning
VaultWhole-board view
Nav → Advanced → Extremes Screener
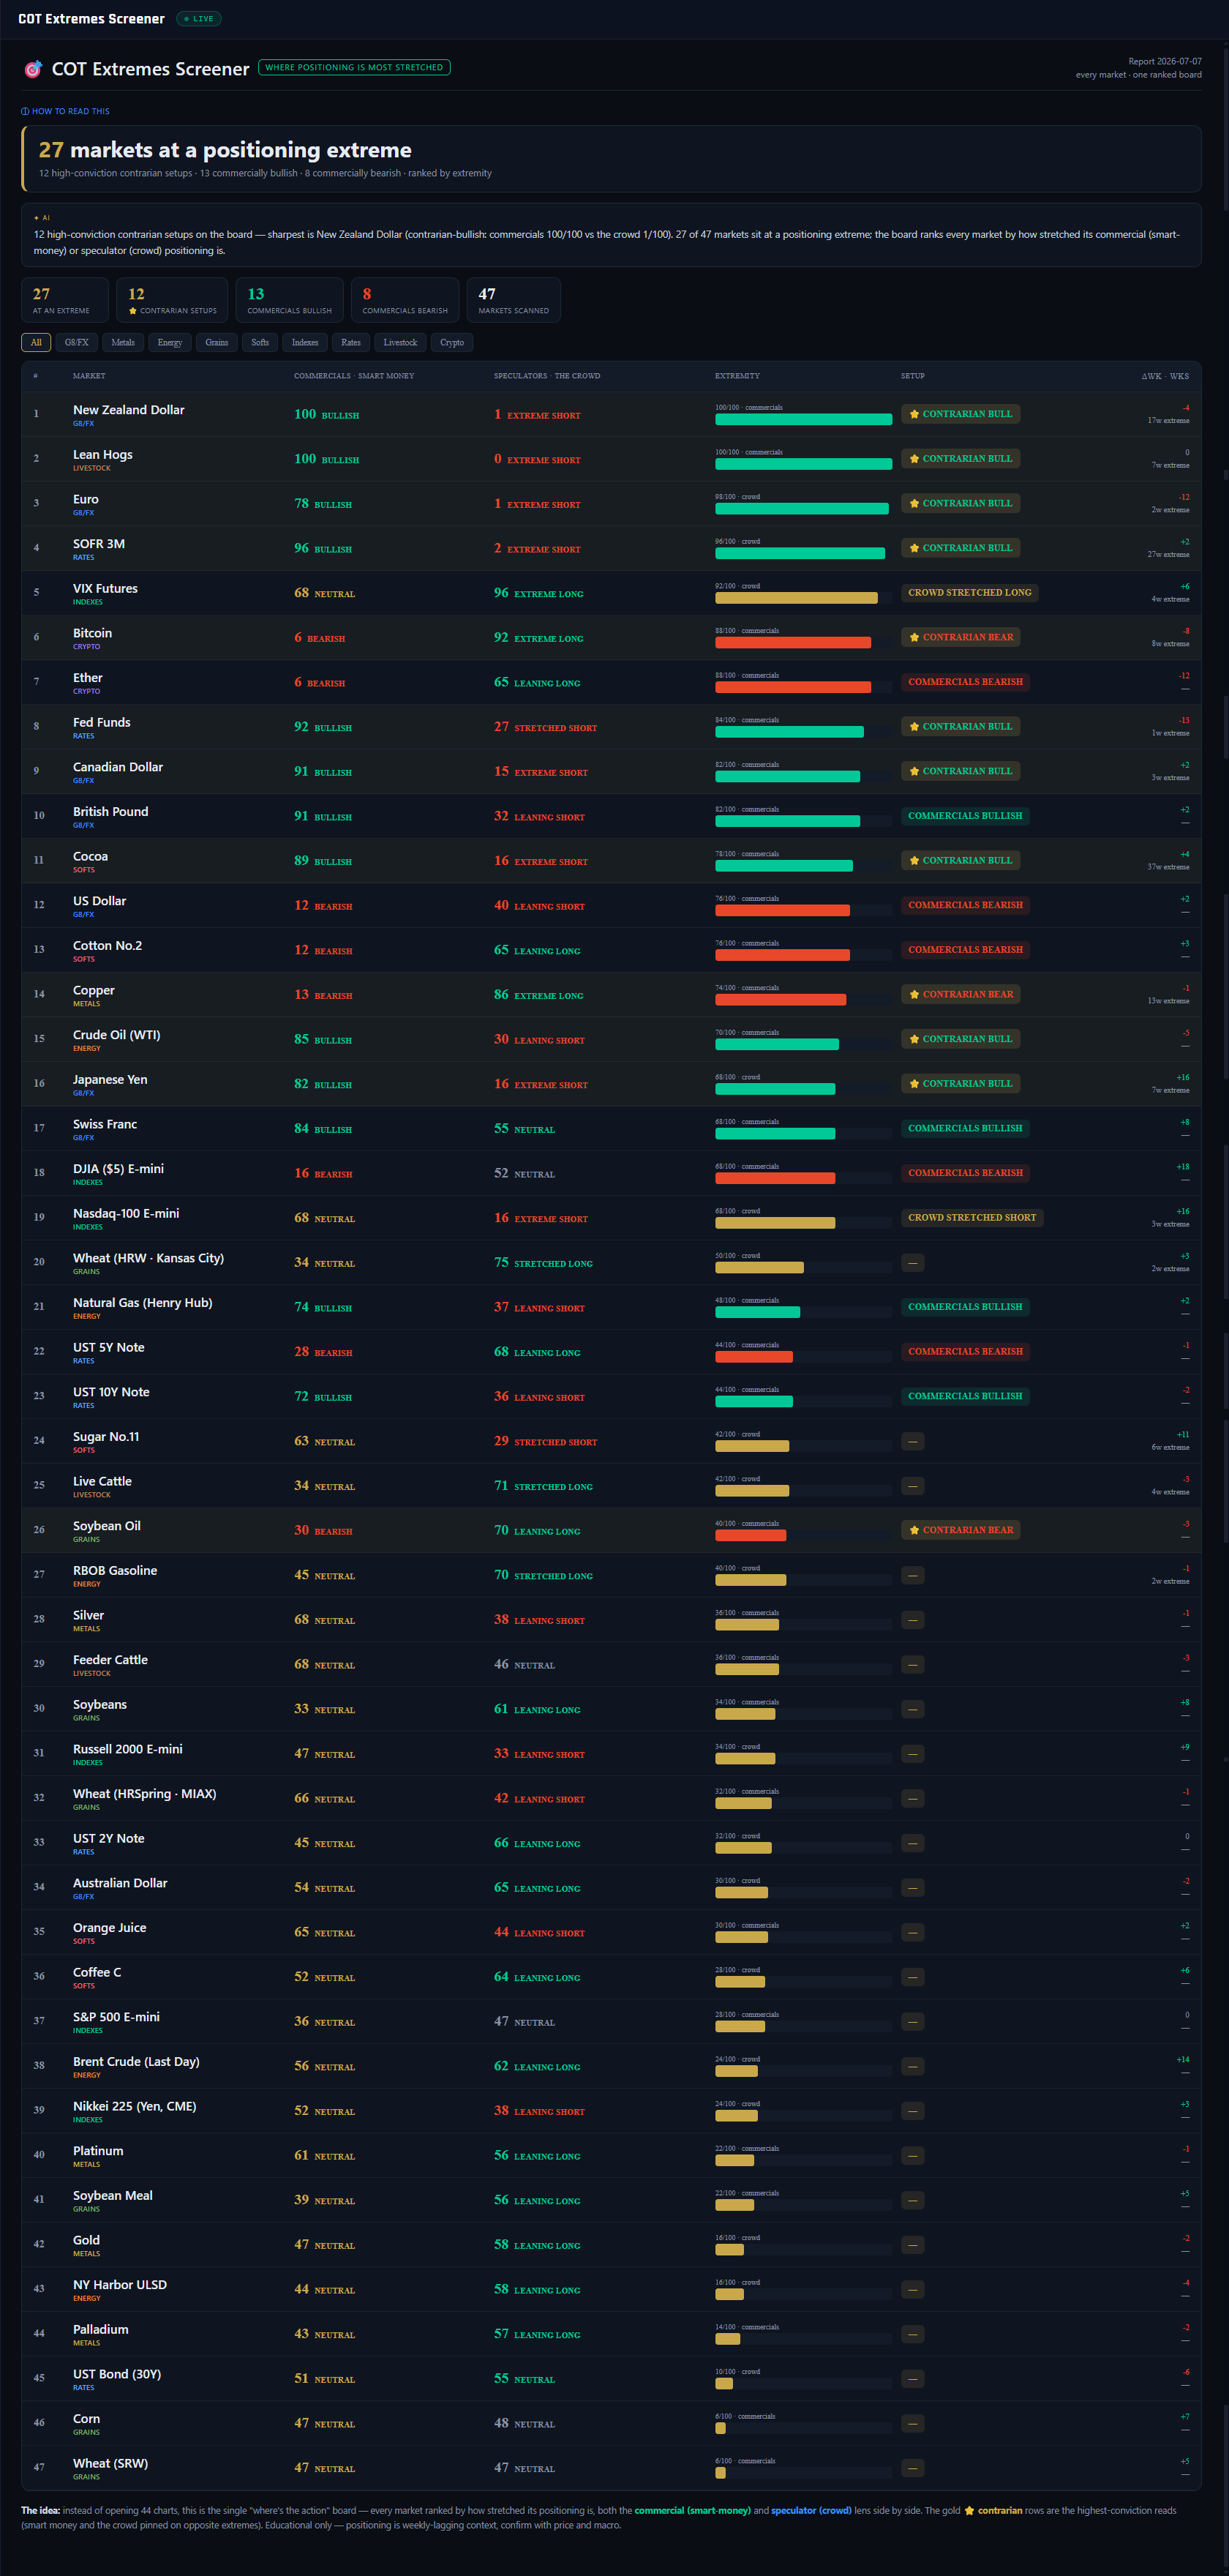
№ MAP PINS — the gold markers on this screenshot point at locations on the panel; each is explained in the legend beside it. (They are separate from the teal STEP numbers in Part 1.)
1
2
3
4
5
6
7
8
9
10
11
12
What it is
The "where's the action" board. Instead of opening 47 charts, the screener ranks every COT market by how stretched its positioning is — reading both legs at once: the commercial index (the hedgers) and the speculator index (Managed Money / Leveraged Funds, the professional crowd). One sorted table, most extreme at the top, with a setup chip that names what kind of stretch each market is showing.
What it measures
Each market's extremity is the more stretched of its two legs: distance of that leg's 0–100 index from a neutral 50, doubled back to a 0–100 scale. A market counts as "at a positioning extreme" once either leg reaches 70+ or 30-or-below. The setup chip then classifies the shape: ★ CONTRARIAN BULL / BEAR — the high-conviction pattern, commercials AND the crowd both pinned at opposite extremes (on this screenshot, NZD ranks #1 with commercials at 100 against the crowd at 1); COMMERCIALS BULLISH / BEARISH — the hedger leg alone is extreme; CROWD STRETCHED LONG / SHORT — only the speculators are extended, which reads as caution rather than a directional lean.
Why it's useful to you
It solves the search problem, honestly. But understand what the ranking is: extremity is a level, not readiness. The board tells you where the spring is most stretched — it says nothing about whether the spring is about to release, and extremes routinely persist for weeks. So work it as radar, then vetting: the screener produces this week's shortlist; the single-market engines — Pressure & Squeeze, Unwind Tracker, Crowding — tell you whether any name on it is actually primed. A market that tops this board AND shows a pressurized spring is a genuine candidate; a market that merely tops this board is a headline.
The 10-second read
Summary tiles, then the ★ CONTRARIAN rows at the top. Anything starred on your watchlist goes straight to the Pressure gauge for vetting. Done.
Use it with: Pressure & Squeeze (is the stretch primed to release?) ·
Unwind Tracker (or already releasing?) ·
COT Triggers (which extremes are NEW this week, not standing)
1
Report date. The CFTC week the whole board reads (2026-07-07) — one ranked board per report, refreshed when the new release lands.
2
Headline banner. The census: "27 markets at a positioning extreme." A number this high isn't a buffet of trades — it tells you stretch is cheap this week and the vetting step matters more, not less.
3
AI note. The AI note names the sharpest setup on the board — here the New Zealand Dollar — and how many high-conviction contrarian patterns are live.
4
Summary tiles. 27 at extreme / 12 contrarian setups / 13 commercially bullish / 8 commercially bearish / 47 scanned. The bull-vs-bear split of the commercial extremes is a one-glance tilt of the whole futures landscape.
5
Class filter chips. All / G8FX / Metals / Energy… — narrow the board to your hunting ground without losing the cross-market ranking logic.
6
COMMERCIALS column. The hedgers' 0–100 index with a bias word. Platform convention: high = commercials heavily net long = bullish backdrop. This is the leg with the historical track record — the anchor of every setup classification.
7
SPECULATORS column. The professional crowd's index (Managed Money / Leveraged Funds). Read it as the mirror: a crowd pinned at 1 while commercials sit at 100 means the two sides of the market maximally disagree.
8
ΔWK · WKS column. This week's index change and how many consecutive weeks the market has been pinned. A 12-week-old extreme that stopped moving is stale; a fresh cross with momentum is a different conversation.
9
Row 1 — New Zealand Dollar. Commercials 100 vs crowd 1: the most stretched stand-off on the entire board, and a textbook contrarian-bull shape. Still a level — the vetting panels decide if it's ready.
10
EXTREMITY bar. The 0–100 ranking metric, drawn so you can see which side is pinned — teal toward the long/bullish edge, red toward the short/bearish edge.
11
SETUP chip. The classification: ★ CONTRARIAN BULL/BEAR (both legs extreme, opposite sides), COMMERCIALS BULLISH/BEARISH (hedger leg only), CROWD STRETCHED (speculator leg only — caution, not direction).
12
"The idea" footer. The board's own honest framing: one ranked view instead of 47 charts — a radar for where positioning is stretched, never a list of trades.