19OI Long/Short Pressure — The Four-State Read
VaultSingle-market view
Nav → Intermediate → OI Long/Short Pressure
№ MAP PINS — the gold markers on this screenshot point at locations on the panel; each is explained in the legend beside it. (They are separate from the teal STEP numbers in Part 1.)
1
2
3
4
5
6
7
8
9
10
11
12
What it is
Price tells you which way the market moved. Open interest tells you who paid for it. Cross the two and every week lands in one of exactly four states — the classic futures-desk read this panel automates. A falling price means something completely different when open interest is rising (new shorts attacking) than when it's falling (old longs giving up). Same candle, opposite story.
What it measures
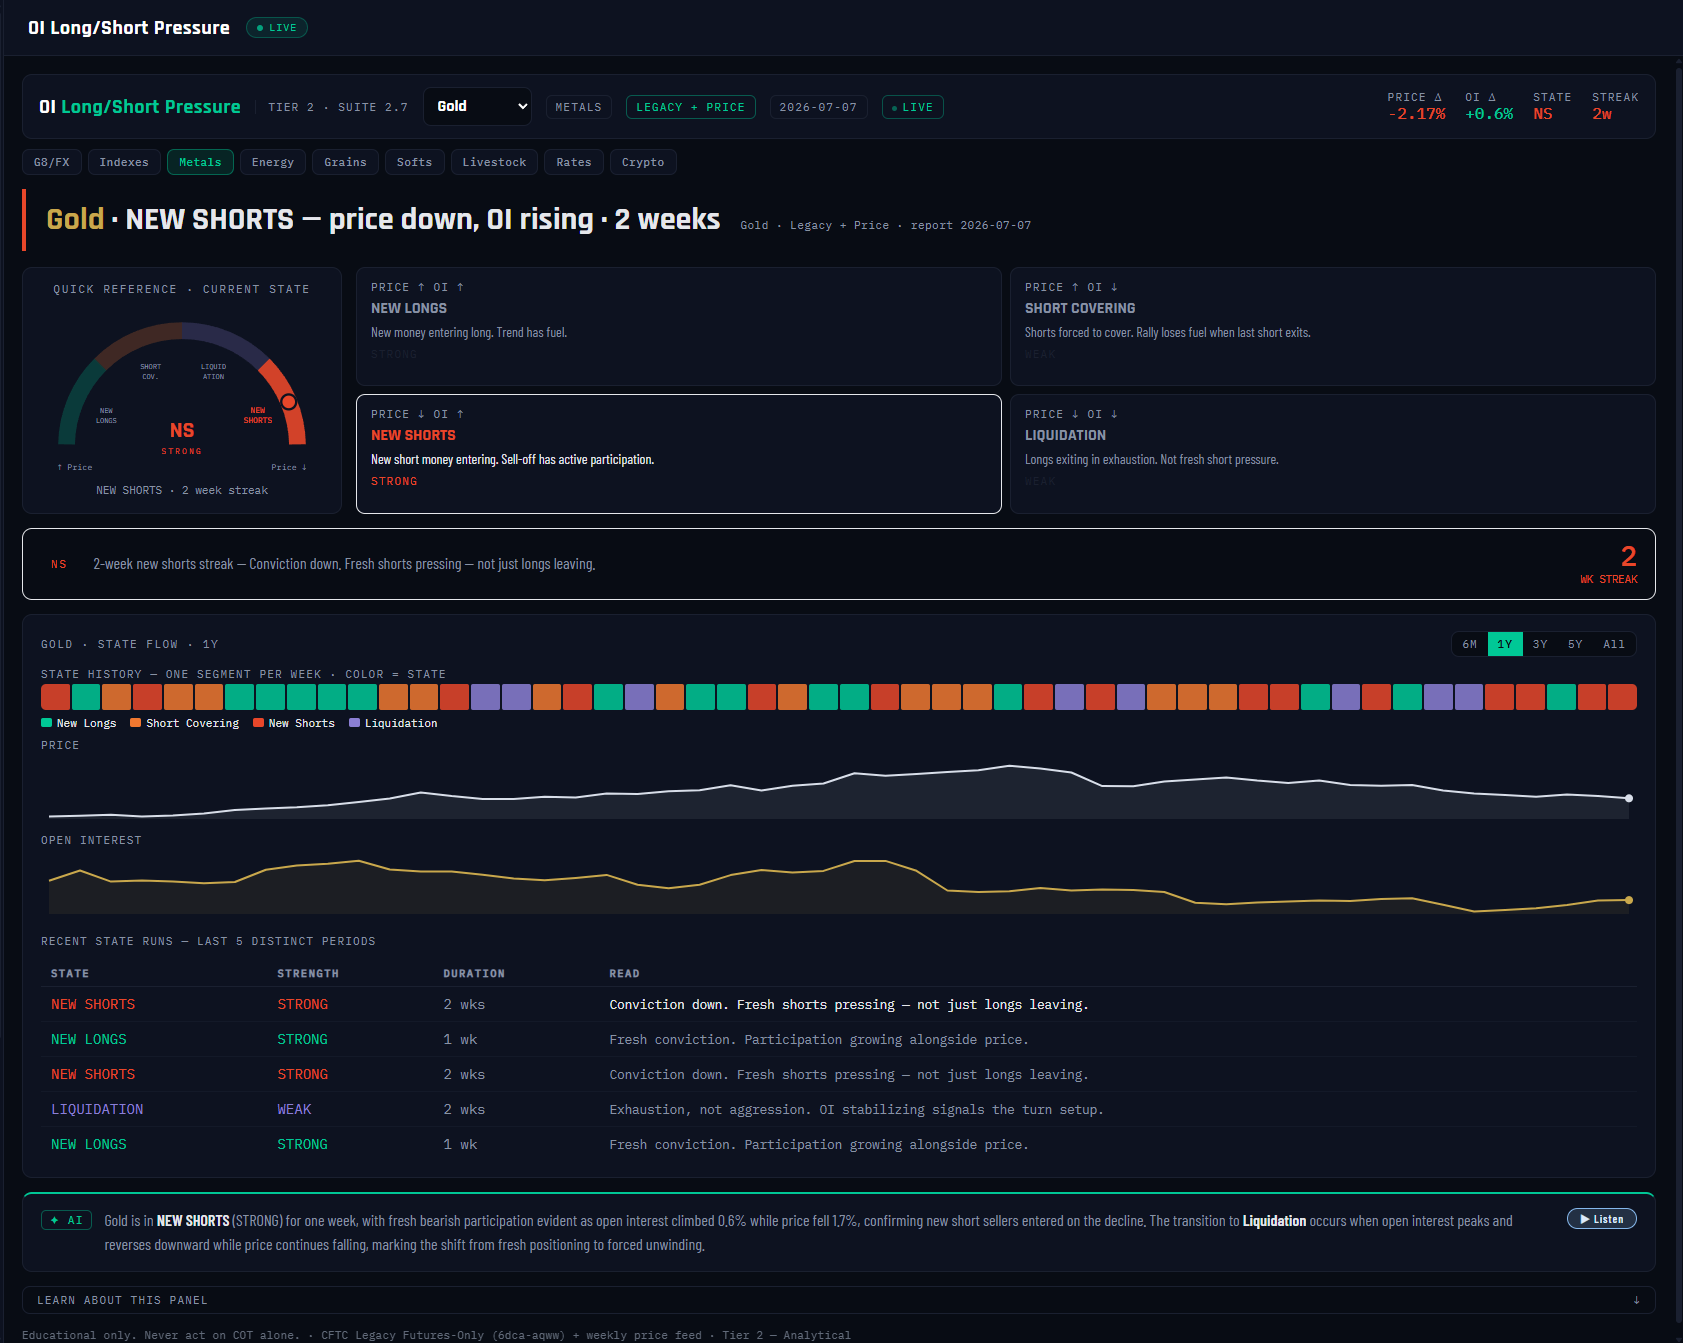
Each week, the sign of the price change × the sign of the OI change: NEW LONGS (price ↑, OI ↑ — fresh conviction, STRONG) · SHORT COVERING (price ↑, OI ↓ — a rally on borrowed time, WEAK) · NEW SHORTS (price ↓, OI ↑ — fresh shorts pressing, STRONG) · LIQUIDATION (price ↓, OI ↓ — exhaustion, not aggression, WEAK). STRONG means fresh participation is funding the move; WEAK means the move is running on positions closing. A dead-band keeps it honest: when price moves less than 0.1% and OI less than 0.2%, the prior state carries over instead of flipping on noise. In the screenshot Gold reads NEW SHORTS, 2 weeks running — price −2.17% with OI +0.6%: the decline is being driven by fresh shorts entering, not just longs leaving.
Why it's useful to you
Because it separates moves worth respecting from moves about to stall. Retail traders chase every rally; this read tells you whether the rally has new money underneath it or is just shorts buying their way out (a fuel tank that empties). Better still, the states transition in readable ways — Gold's NEW SHORTS shifts to Liquidation the moment OI peaks and turns down while price keeps falling, which is exactly what the panel tells you to watch for. Four states, four playbooks.
The 10-second read
Read the active quadrant and its strength: STRONG = fresh money funding the move, respect it. WEAK = the move runs on closing positions — it stalls when the closing exhausts. Then note the streak.
Use it with: Velocity & Flow (which group is driving the OI change) ·
Divergence Detection (does positioning agree with the price leg?) ·
Pressure & Squeeze (OI expansion is one of its five components)
1
Panel title + market dropdown. OI Long/Short Pressure · Tier 2 · Suite 2.7, on Gold. The data badge reads Legacy + Price — the one Intermediate panel that pairs CFTC data with a weekly price feed, aligned to the same report week.
2
Stat chips. PRICE Δ −2.17% · OI Δ +0.6% · STATE NS · STREAK 2w. The two deltas are the entire input; the state is their crossing.
3
Verdict banner. "NEW SHORTS — price down, OI rising · 2 weeks." The four-state read in plain English, with its duration.
4
Quick-reference state dial. The current state (NS) and its strength class at a glance — the panel's answer before you read anything else.
5
NEW LONGS quadrant. Price ↑ + OI ↑: fresh conviction — participation growing alongside price. The strongest bullish configuration.
6
SHORT COVERING quadrant. Price ↑ + OI ↓: the rally is shorts exiting, not buyers arriving — borrowed time; it stalls when the covering pool exhausts.
7
NEW SHORTS quadrant — active. Price ↓ + OI ↑, highlighted and marked STRONG: fresh shorts are pressing Gold, not just longs leaving. Conviction is on the downside this week.
8
LIQUIDATION quadrant. Price ↓ + OI ↓: exhaustion — longs exiting without new shorts replacing them. Weak, and often late in a decline.
9
State history strip. One colored segment per week across the whole window. Read it like weather history: long single-color runs are trending participation; rapid color-flipping is a market with no participation story. Grey segments mark weeks with no aligned price data.
10
Price and Open Interest tracks. The two raw ingredients plotted separately beneath the strip, so you can verify any state with your own eyes: find the week, check which way each line moved.
11
Recent state runs. The last five distinct state periods with their durations — the market's recent "participation narrative" in table form.
12
AI analysis + Listen. Two sentences: the current state and whether the move has fresh participation, then the transition watch — for Gold's NEW SHORTS: when OI peaks and turns down while price is still falling, it shifts to Liquidation.