What it is
The platform's original squeeze desk, kept deliberately as a reference view. It runs its own pressure model on the Legacy futures-only report — Non-Commercials (all large speculators as one group) versus Commercials — while the Advanced-tier Pressure & Squeeze Gauge reads the Disaggregated/TFF report (Managed Money or Leveraged Funds versus the hedger categories). Different report family, different cohort split — so the two gauges can legitimately disagree, and that's the point: this one is the classic, coarser lens, and a second opinion on the same spring. When both read pressurized, take notice.
What it measures
The Pressure Score (0–100) is a three-input composite built from the COMM Index: spec exposure (55% weight — how far the COMM Index sits from a neutral 50, doubled; in the Legacy report the speculators are the commercials' mirror, so this is how extreme the stand-off is), commercial cover rate (25% — the week-over-week change in the COMM Index, i.e. how fast the hedgers are repositioning), and spec lag (20% — how long positioning has stayed pinned at an extreme). The ladder: DORMANT 0–39 → BUILDING 40–74 → PRESSURIZED 75–89 → CRITICAL 90–100. The separate Density index answers "how much fuel?" — concentration of the stand-off (45%), market size via OI percentile (35%), and time elevated (20%). High pressure in a dense market unwinds hard; both CRITICAL at once is the panel's kill-zone condition.
Why it's useful to you
Squeezes are where COT stops being slow context and starts explaining violent weeks. When one side of a market is extreme, stale and concentrated, its exit is small — a catalyst forces covering, covering moves price, and the move feeds itself. This panel scores that stored energy per currency, names the trapped side (a bearish squeeze means the speculators are net short and trapped — resolution forces the currency up as they cover), and then hands you the discipline: the three-step confirmation at the bottom insists COT, macro and your own technicals agree before anything becomes a trade. Pressure is potential energy — never a trigger by itself.
The 10-second read
TOP CONTENDERS strip: anything PRESSURIZED or CRITICAL? Click it, read the squeeze direction and density, then cross-check the Advanced gauge. Two lenses agreeing beats one lens screaming.
Use it with: Pressure & Squeeze Gauge (the canonical Disaggregated/TFF model — compare the two reads) ·
Unwind Tracker (has the release started?) ·
COT Triggers (the week a squeeze arms, logged)
1
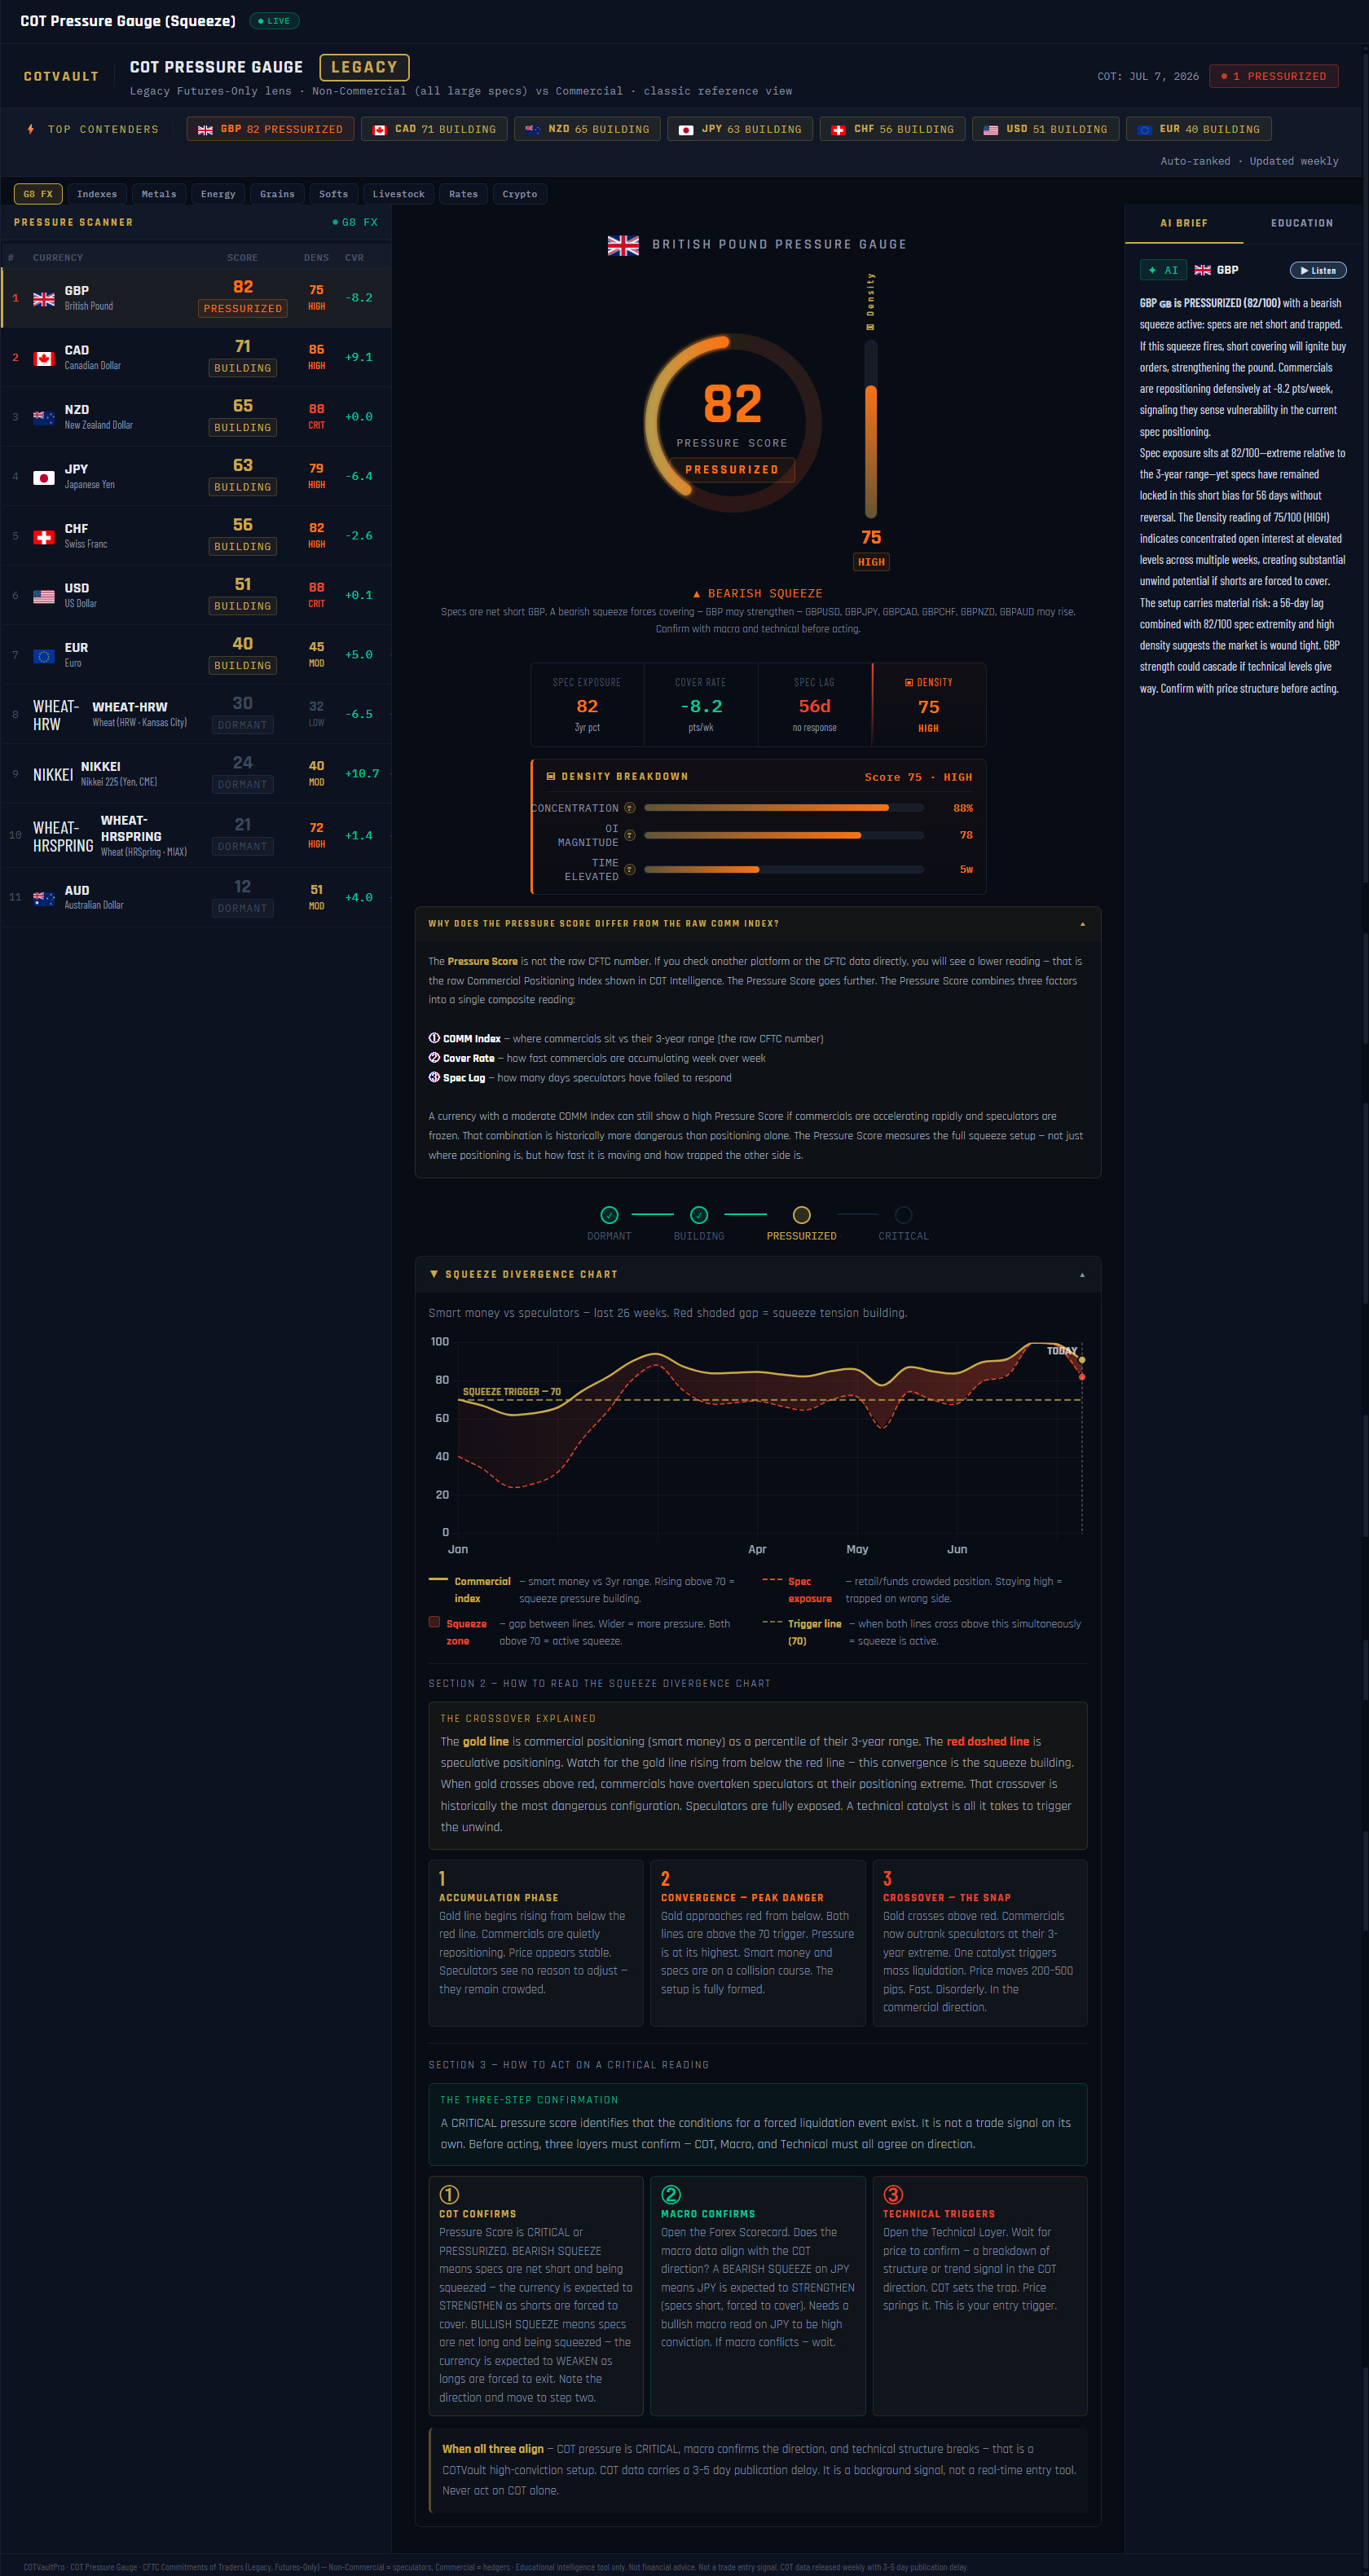
Title + LEGACY badge. The badge is a data label, not an age warning: this gauge reads the CFTC's Legacy futures-only report — Non-Commercial (all large specs) vs Commercial — the classic reference lens.
2
TOP CONTENDERS strip. The highest-pressure markets right now — GBP 82 PRESSURIZED, CAD 71 BUILDING… Your entry point into the panel every week.
3
Pressure Scanner table. Every market ranked by pressure score (the class filter defaults to G8 FX). Click a row to load its full gauge — GBP is selected here.
4
SCORE / DENSITY / CVR columns. The composite score, the fuel index, and the cover rate (CVR — this week's COMM Index change). A high score with a big cover rate means the hedgers are already moving.
5
Circular gauge. The selected market's pressure score — GBP at 82, PRESSURIZED. One number for how coiled the commercials-vs-speculators spring is.
6
Density thermometer. 75 — HIGH. The breakdown below it shows the inputs: concentration of the stand-off 88, OI magnitude 78, time elevated 5 weeks. Pressure says a move is loaded; density says how big the tank is.
7
Squeeze direction verdict. BEARISH SQUEEZE — commercials are net long, so the speculators are net short and trapped. Resolution of a bearish squeeze forces the currency up as the shorts cover: GBPUSD and GBPJPY rising.
8
Metric cards. The composite, unbundled: SPEC EXPOSURE 82 · COVER RATE −8.2 (the COMM Index moved 8.2 points this week — fast hedger repositioning) · SPEC LAG 56 days pinned at an extreme · DENSITY 75. The panel also explains why this composite can differ from the raw COMM Index alone.
9
AI BRIEF column. The AI narrative for the selected currency — what the score, density and direction add up to this week — with a Listen button.
10
Stage strip. DORMANT → BUILDING → PRESSURIZED → CRITICAL, with the current market placed on it. CRITICAL plus CRITICAL density is the kill-zone configuration — maximum stored energy, disorderly unwind risk.
11
Squeeze divergence chart. The gold commercial index line against the red spec exposure line over 26 weeks, with the trigger line at 70. The panel reads the sequence as accumulation → convergence → crossover — the lines converging and crossing is historically the most dangerous configuration, the spring at full compression.
12
Three-step confirmation. The discipline block: COT confirms → macro confirms → your technicals trigger. Pressure alone never places the trade; extremes can persist for weeks before resolving, and this panel says so in its own footer.