17Structure Scanner — The Gross Behind the Net
VaultSingle-market view
Nav → Intermediate → Structure Scanner
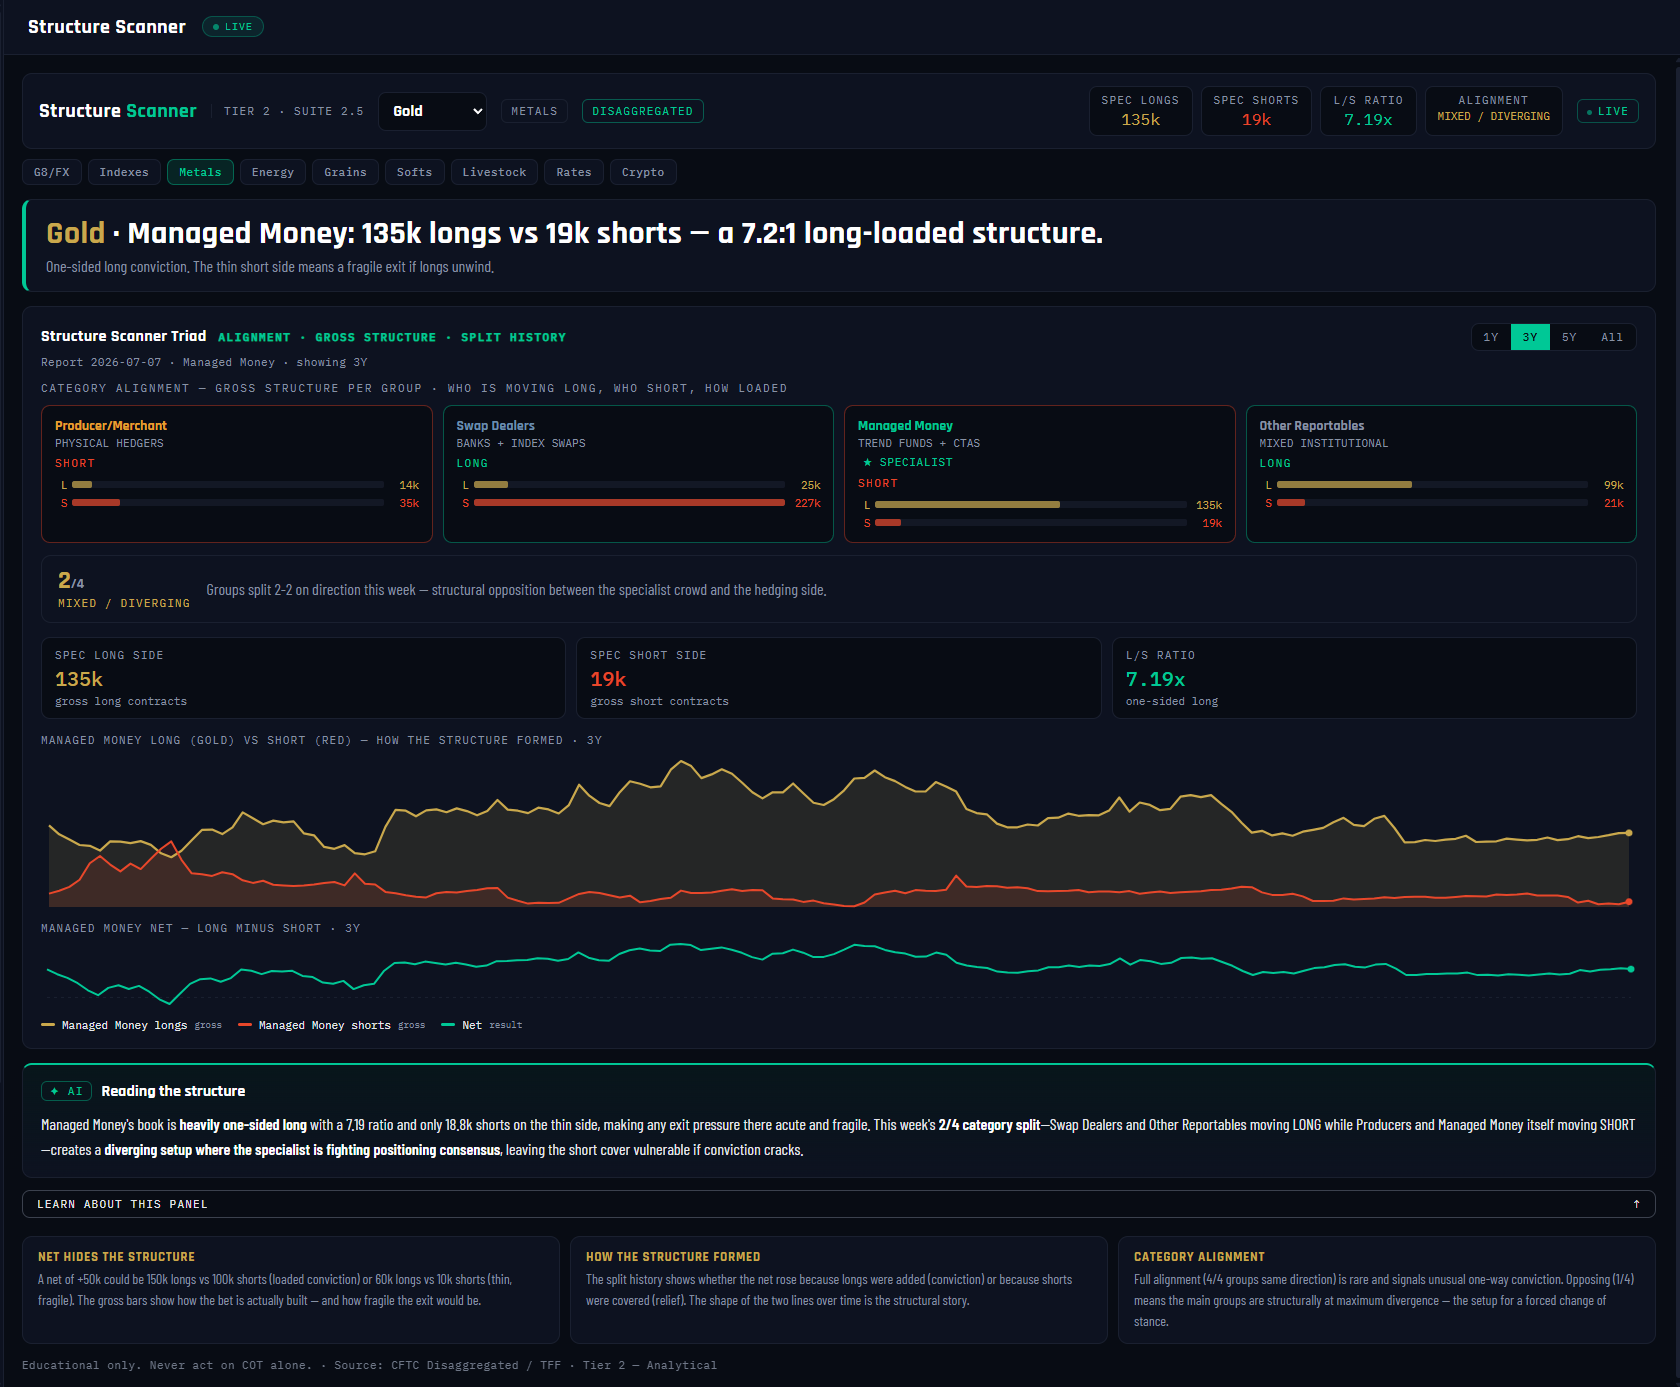
№ MAP PINS — the gold markers on this screenshot point at locations on the panel; each is explained in the legend beside it. (They are separate from the teal STEP numbers in Part 1.)
1
2
3
4
5
6
7
8
9
10
11
12
What it is
Every panel so far has shown you the net — longs minus shorts. The Structure Scanner shows you the gross: how many long contracts and how many short contracts each group actually holds. That distinction matters more than it sounds. A net of +116k could be 135k longs against 19k shorts, or 400k longs against 284k shorts — the same net, two completely different markets. The first is a one-way conviction bet; the second is a heavily contested battlefield.
What it measures
Three things. First, the gross long/short loading of all four report groups — one card each, with the specialist crowd starred. Second, the specialist's long-to-short ratio: in the Gold screenshot, Managed Money holds 135k longs against just 19k shorts — a 7.19:1 long-loaded structure (anything beyond 2:1 counts as one-sided long; below 0.5:1 is one-sided short; between is a contested book). Third, category alignment: which direction each group moved this week — a group counts as LONG or SHORT only if its net shifted by more than a thousand contracts, otherwise it reads MIXED. Spreading positions are excluded throughout because they carry no direction.
Why it's useful to you
Because the gross structure tells you where the fragile exit is. In Gold's 7.2:1 book, the short side is thin — if those crowded longs ever need to leave, there is almost nobody on the other side to sell to, so the exit becomes an air pocket. The alignment read adds the week's tactical picture: Gold shows 2/4 MIXED / DIVERGING, the normal state where specialists and hedgers pull against each other. When it flips to 3/4 or 4/4 — every group shifting the same way in the same week — that's rare, one-way conviction across the entire report, and worth your full attention.
The 10-second read
Check the L/S ratio chip first: beyond 2:1 either way, note which side is thin — that's the fragile exit. Then glance at alignment: 3/4 or 4/4 means the whole report moved together this week.
Use it with: Concentration & Quality (how few hands hold that loaded side) ·
Velocity & Flow (is the loaded side still building?) ·
Pressure & Squeeze (has the loading become structural tension?)
1
Panel title + market dropdown. Structure Scanner · Tier 2 · Suite 2.5, reading Gold on the Disaggregated report — so the starred specialist is Managed Money.
2
Stat chips. The whole verdict in four numbers: SPEC LONGS 135k · SPEC SHORTS 19k · L/S RATIO 7.19x · ALIGNMENT MIXED. Everything below unpacks these.
3
Verdict banner. "135k longs vs 19k shorts — a 7.2:1 long-loaded structure." The plain-English headline: this net was built almost entirely from the long side.
4
Producer/Merchant card. The physical hedgers' gross book, with a direction chip showing which way they moved this week (here: SHORT). Direction is the week's shift, never the level.
5
Swap Dealers card. The banks' book — carrying a heavy 227k gross short in Gold, yet their chip reads LONG because they added this week. Level and movement are separate facts; this panel shows both.
6
Managed Money card — ★ SPECIALIST. The crowd this market's read anchors on: 135k longs / 19k shorts. Its weekly chip reads SHORT — even a crowded long book can trim in any given week.
7
Other Reportables card. The fourth group — large traders that fit neither hedger nor fund buckets. Completes the 4-group alignment count.
8
Alignment banner. Gold reads 2/4 MIXED / DIVERGING — normal structural opposition. The ladder runs OPPOSING (0–1) → MIXED (2) → STRONG (3) → FULL AGREEMENT (4); the top rung means all four groups shifted the same direction in one week.
9
Gross history chart. Managed Money's long side (gold line) and short side (red line) plotted separately over 3 years. You can see how the net formed — longs built while shorts stayed flat, i.e. fresh conviction, not short covering.
10
Net line. The familiar net (long minus short) below the gross tracks — so you can see exactly what the single net line hides in the chart above it.
11
AI "Reading the structure." A two-sentence plain-English read: how loaded the book is, which side is thin, and what the alignment means. Refreshed each report week.
12
Education cards. NET HIDES THE STRUCTURE / HOW IT FORMED / CATEGORY ALIGNMENT — the built-in lesson if any of the above needs a refresher.