23Unwind Tracker — Tracking the Release
VaultSingle-market view
Nav → Advanced → Unwind Tracker
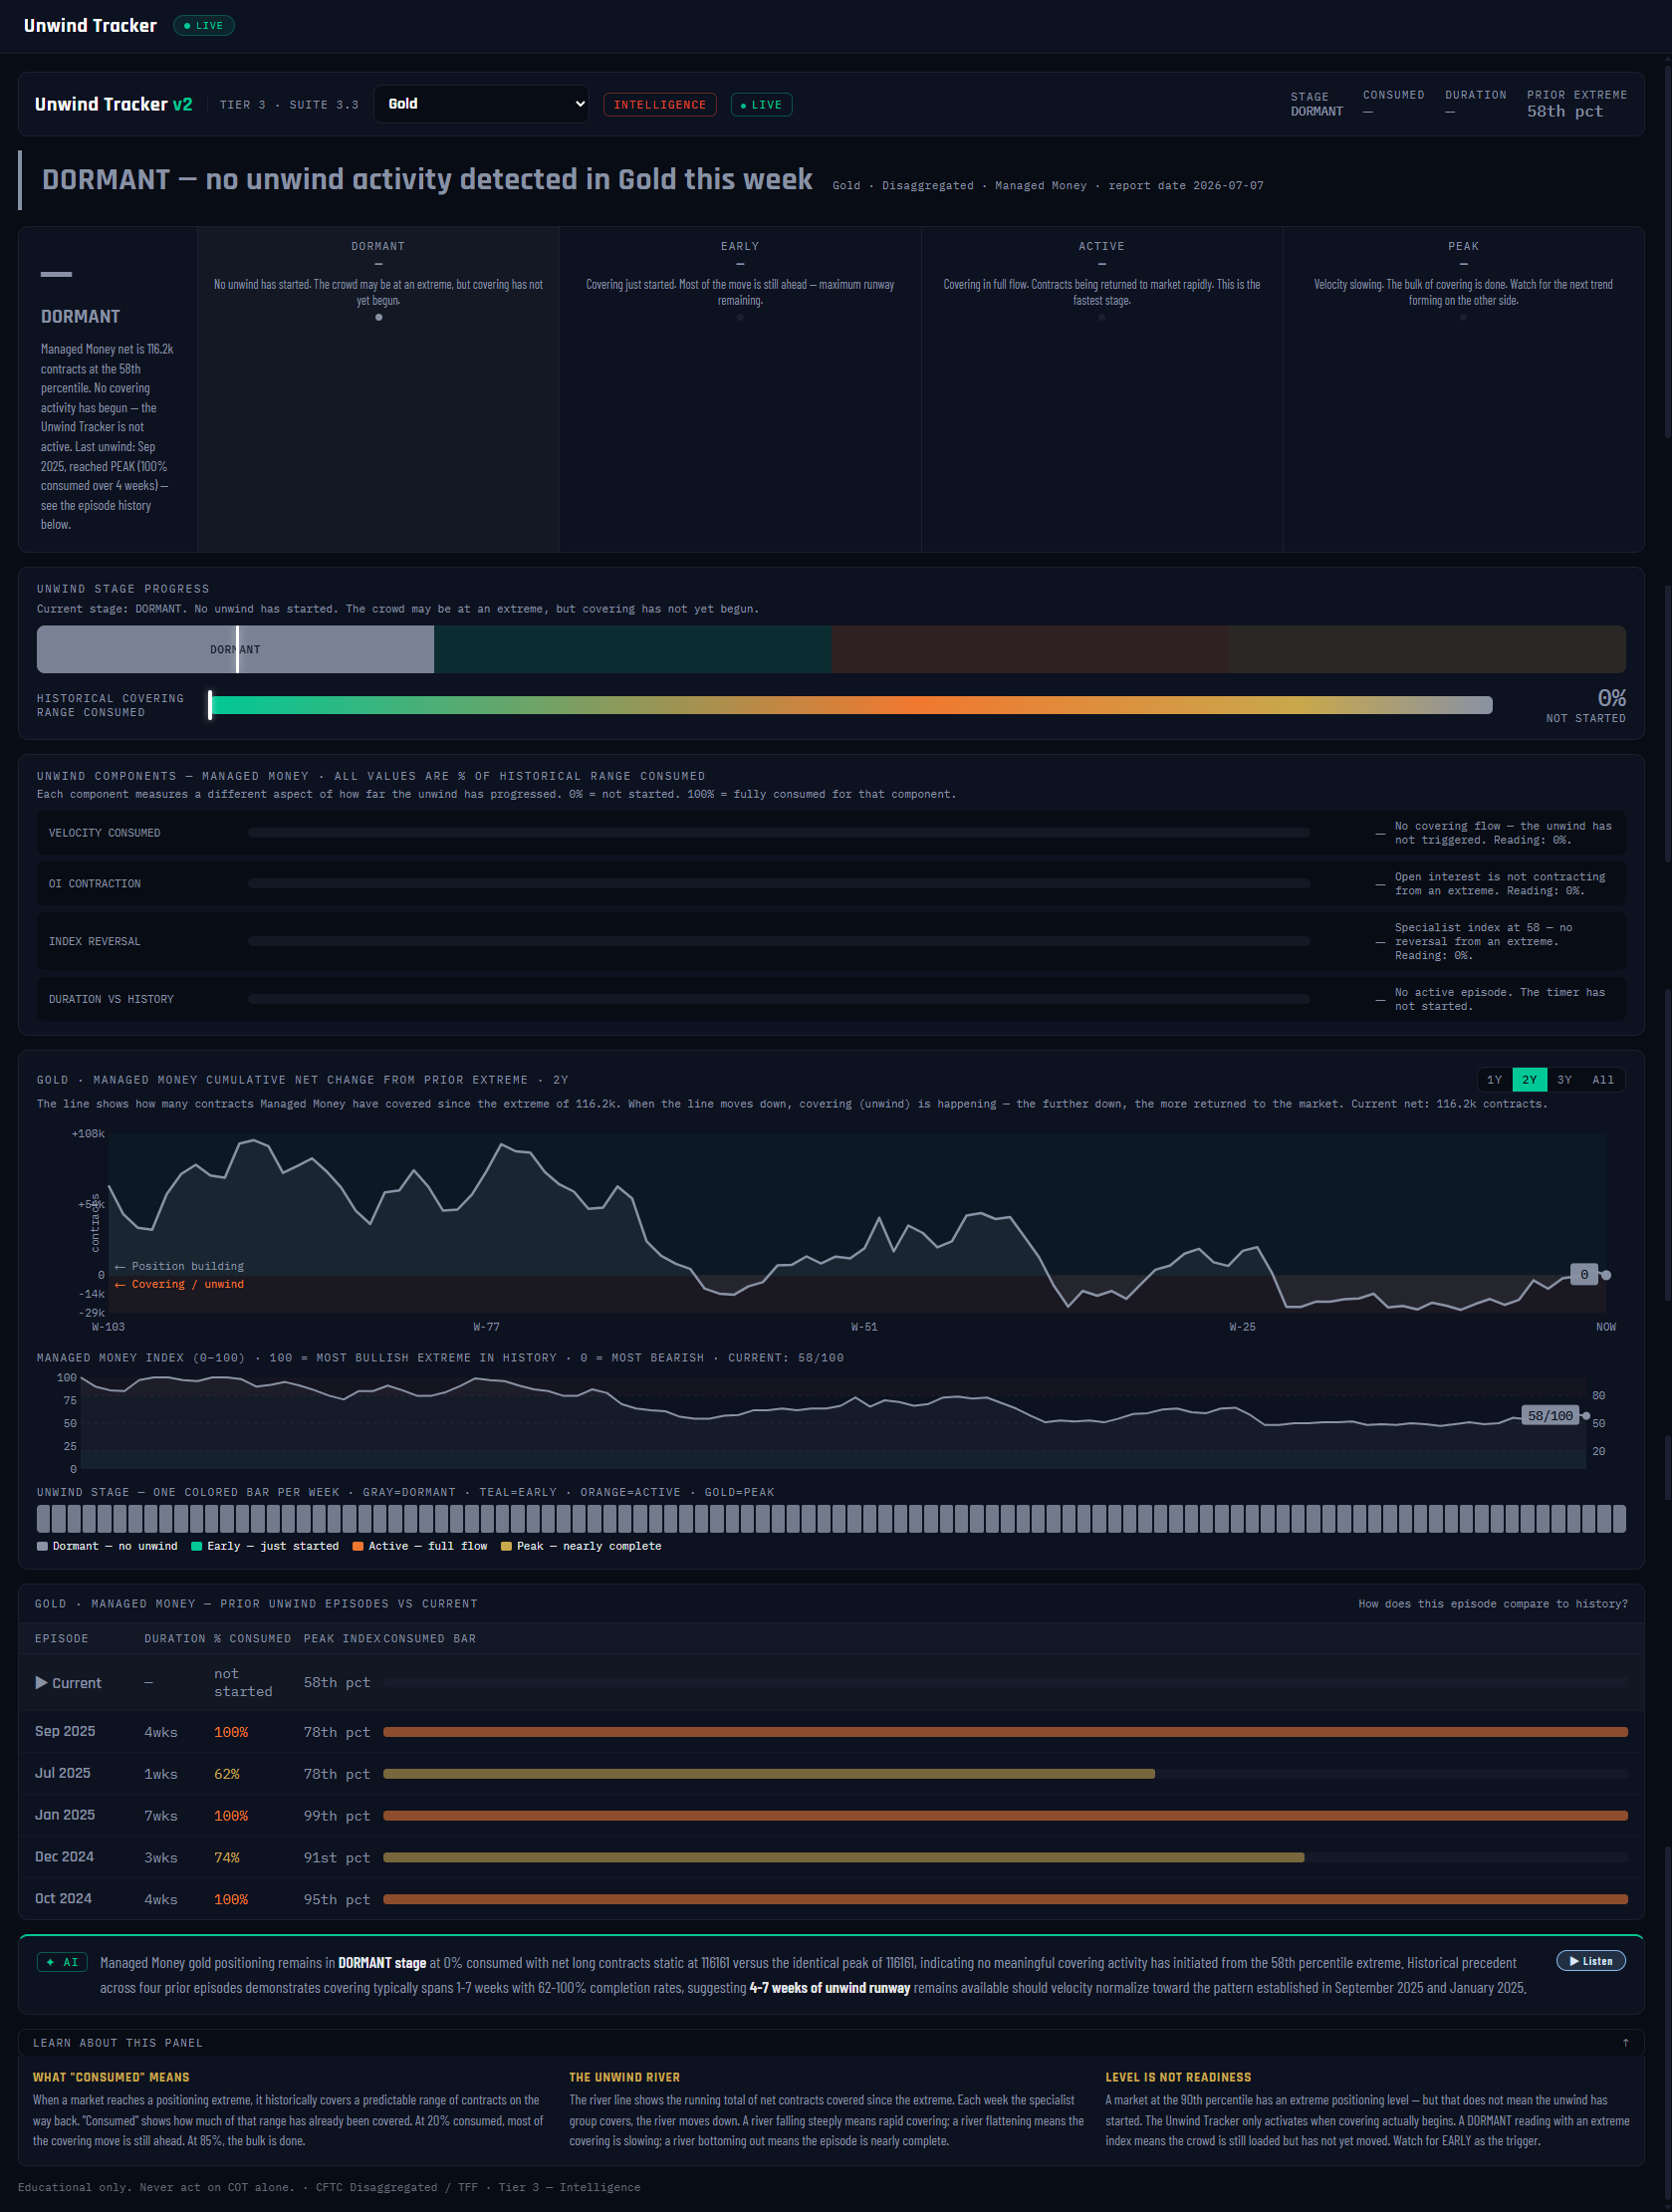
№ MAP PINS — the gold markers on this screenshot point at locations on the panel; each is explained in the legend beside it. (They are separate from the teal STEP numbers in Part 1.)
1
2
3
4
5
6
7
8
9
10
11
12
What it is
The whole platform keeps repeating one law: the unwind — not the extreme — is the tradable event. Extremes can sit for months; the money is made (or lost) when the crowded position starts to release, because forced exits feed on themselves. This panel is that law's instrument: it detects when an unwind actually begins after a positioning extreme, then tracks its progress week by week — like a storm tracker for position covering.
What it measures
An unwind triggers on three conditions together: the pressure gauge read Pressurized or Critical in recent weeks, the specialist index printed an extreme (roughly 70+ or 30-and-below), and velocity flipped direction — the crowd started covering. From that trigger the panel measures % consumed: how much of this market's typical historical covering range has been eaten so far, staged as DORMANT → EARLY (under 35%) → ACTIVE (35–74%) → PEAK (75%+). Four components decompose it — covering velocity, OI contraction, index reversal, duration vs history. Gold in the screenshot reads DORMANT: the prior extreme sat at only the 58th percentile, 0% consumed, all four components at zero — no unwind exists this week, and the panel says so plainly rather than inventing one.
Why it's useful to you
Because it answers the question that ruins most contrarian trades: how much is left? Jumping on an unwind at 80% consumed means catching the last of a move; catching it EARLY means most of the covering is still ahead. The episode history is the calibration: Gold's prior unwinds ran to 100% consumed in Sep 2025 and Jan 2025, and 62% in Jul 2025 — so when the next one triggers, you'll know what a full release looks like in this market, and the AI note can honestly frame it as several weeks of remaining runway rather than a guess. Level is not readiness; a DORMANT read is real information: nothing to chase.
The 10-second read
Stage + % consumed. DORMANT = nothing live. EARLY = the release just started — most runway ahead. ACTIVE = mid-release. PEAK = mostly done; the easy part of the move is behind you.
Use it with: Pressure & Squeeze (the upstream gauge — its Pressurized/Critical state arms this tracker) ·
Extremes & Percentile (the extreme this panel waits on) ·
Edge Lab (how unwind-flavored signals have actually performed since 2006)
1
Panel title + market dropdown. Unwind Tracker v2 · Tier 3 · Suite 3.3, on Gold — tracking the Managed Money crowd's covering behavior.
2
Stat chips. STAGE DORMANT · CONSUMED — · PRIOR EXTREME 58th pct. The consumed chip is blank because there is no active episode to measure.
3
Verdict banner. "DORMANT — no unwind activity detected in Gold this week." An honest zero: the most recent positioning peak (58th percentile) never qualified as an extreme, so there is nothing to unwind.
4
Stage cards. DORMANT (active) / EARLY / ACTIVE / PEAK — the four-stage arc every unwind travels. The highlighted card is the current stage; the thresholds are % consumed, not vibes.
5
Stage progress bar. Where inside the arc the current episode sits. Parked at DORMANT for Gold — it starts filling the week a trigger fires.
6
Historical covering range consumed. 0% — NOT STARTED. The headline metric: current covering measured against the median range of this market's own completed unwinds.
7
Unwind components. Velocity consumed / OI contraction / index reversal / duration — each 0% here. During a live episode these tell you which kind of unwind it is: velocity-led (panicky) or slow-bleed.
8
Cumulative net-change river. Two years of accumulated position change from the prior extreme — downhill = covering. During an unwind you literally watch the river drain; flat means the crowd is holding.
9
Specialist index strip. Managed Money's index week by week (58/100 now) — the context track that shows whether positioning is even near the extremes this tracker waits for.
10
Stage color strip. Every week tinted by unwind stage: grey = dormant, teal = early, orange = active, gold = peak. Past episodes appear as colored bursts in a grey field — you can count them at a glance.
11
Prior unwind episodes. The calibration table: each past episode's duration, % consumed and peak index — Sep 2025 ran to 100%, Jul 2025 stopped at 62%, Jan 2025 hit 100%. This is what "typical" means in the consumed metric above.
12
AI analysis + Listen. Two sentences: the stage with the actual contract numbers, then what the episode history implies about remaining covering runway — here framed as roughly 4–7 weeks once an unwind actually triggers.